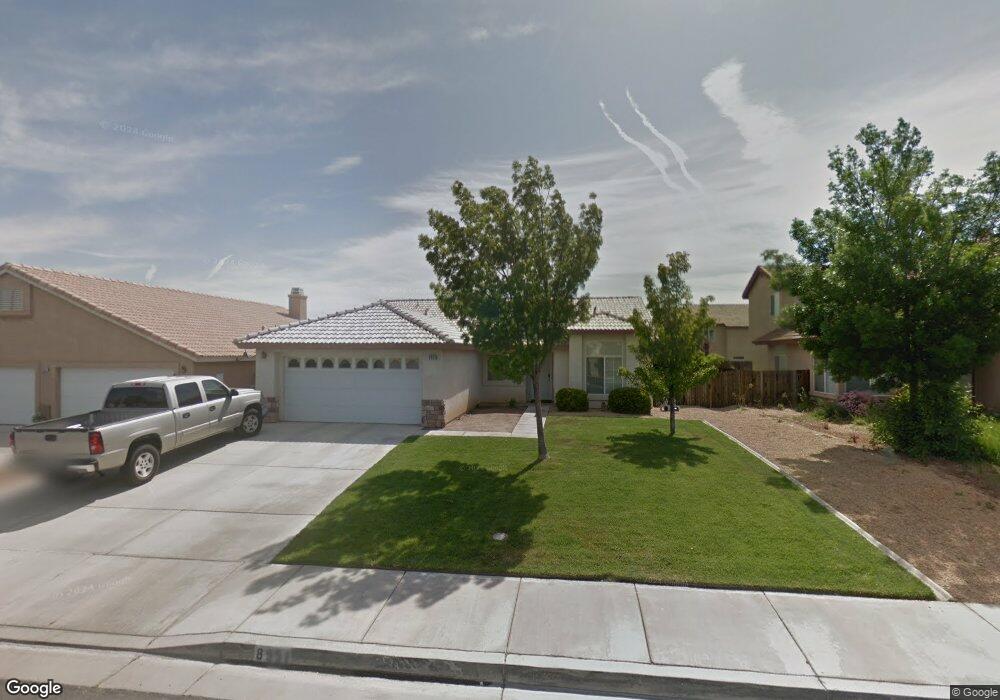
8951 Fallbrook Ct Hesperia, CA 92344
High Country NeighborhoodEstimated Value: $425,187 - $471,000
3
Beds
2
Baths
1,859
Sq Ft
$242/Sq Ft
Est. Value
About This Home
This home is located at 8951 Fallbrook Ct, Hesperia, CA 92344 and is currently estimated at $449,297, approximately $241 per square foot. 8951 Fallbrook Ct is a home located in San Bernardino County with nearby schools including Cottonwood Elementary School, Cedar Middle School, and Oak Hills High School.
Ownership History
Date
Name
Owned For
Owner Type
Purchase Details
Closed on
Oct 23, 2001
Sold by
Hesperia Maple Street Development Lp
Bought by
Benton Mark A and Benton Debra J
Current Estimated Value
Home Financials for this Owner
Home Financials are based on the most recent Mortgage that was taken out on this home.
Original Mortgage
$140,841
Interest Rate
7.13%
Mortgage Type
FHA
Create a Home Valuation Report for This Property
The Home Valuation Report is an in-depth analysis detailing your home's value as well as a comparison with similar homes in the area
Home Values in the Area
Average Home Value in this Area
Purchase History
| Date | Buyer | Sale Price | Title Company |
|---|---|---|---|
| Benton Mark A | $143,000 | Lawyers Title Company |
Source: Public Records
Mortgage History
| Date | Status | Borrower | Loan Amount |
|---|---|---|---|
| Previous Owner | Benton Mark A | $140,841 |
Source: Public Records
Tax History
| Year | Tax Paid | Tax Assessment Tax Assessment Total Assessment is a certain percentage of the fair market value that is determined by local assessors to be the total taxable value of land and additions on the property. | Land | Improvement |
|---|---|---|---|---|
| 2025 | $2,497 | $220,039 | $51,706 | $168,333 |
| 2024 | $2,442 | $215,724 | $50,692 | $165,032 |
| 2023 | $2,415 | $211,494 | $49,698 | $161,796 |
| 2022 | $2,360 | $207,348 | $48,724 | $158,624 |
| 2021 | $2,264 | $198,284 | $47,770 | $150,514 |
| 2020 | $2,237 | $196,251 | $47,280 | $148,971 |
| 2019 | $2,192 | $192,403 | $46,353 | $146,050 |
| 2018 | $2,150 | $188,630 | $45,444 | $143,186 |
| 2017 | $2,113 | $184,931 | $44,553 | $140,378 |
| 2016 | $2,069 | $181,304 | $43,679 | $137,625 |
| 2015 | $2,043 | $178,581 | $43,023 | $135,558 |
| 2014 | $1,813 | $157,600 | $31,100 | $126,500 |
Source: Public Records
Map
Nearby Homes
- 8910 Glenwood Ave
- 14134 Hartford St
- 14424 Plymouth St
- 8874 Tamarisk Ave
- 8910 Newcastle Ave
- 14194 Hartford St
- 14191 Hartford St
- 14148 Hartford St
- 14152 Nantucket St
- 14122 Hartford St
- 0 Tamarisk Ave Unit HD23052637
- 8756 Oakwood Ave
- 9105 Aspenwood Ln
- 14131 Desert Rose St
- 8541 Dove Creek Trail
- 9329 Sable Ridge Ave
- 14405 Cedar St
- 7158 Doheny Ct
- 17714 Doheny Ct
- 9426 Tamarisk Ave Unit 21
- 8943 Fallbrook Ct
- 8961 Fallbrook Ct
- 8956 Glenwood Ave
- 8935 Fallbrook Ct
- 8946 Glenwood Ave
- 8960 Glenwood Ave
- 8938 Glenwood Ave
- 8952 Fallbrook Ct
- 8944 Fallbrook Ct
- 8962 Fallbrook Ct
- 8929 Fallbrook Ct
- 14402 Nantucket St
- 8936 Fallbrook Ct
- 14390 Nantucket St
- 14414 Nantucket St
- 14378 Nantucket St
- 14428 Nantucket St
- 8930 Fallbrook Ct
- 8925 Fallbrook Ct
- 8951 Hanford Ave
Your Personal Tour Guide
Ask me questions while you tour the home.