8954 E South Circle Dr Effingham, IL 62401
Estimated Value: $193,000 - $325,000
3
Beds
2
Baths
1,634
Sq Ft
$162/Sq Ft
Est. Value
About This Home
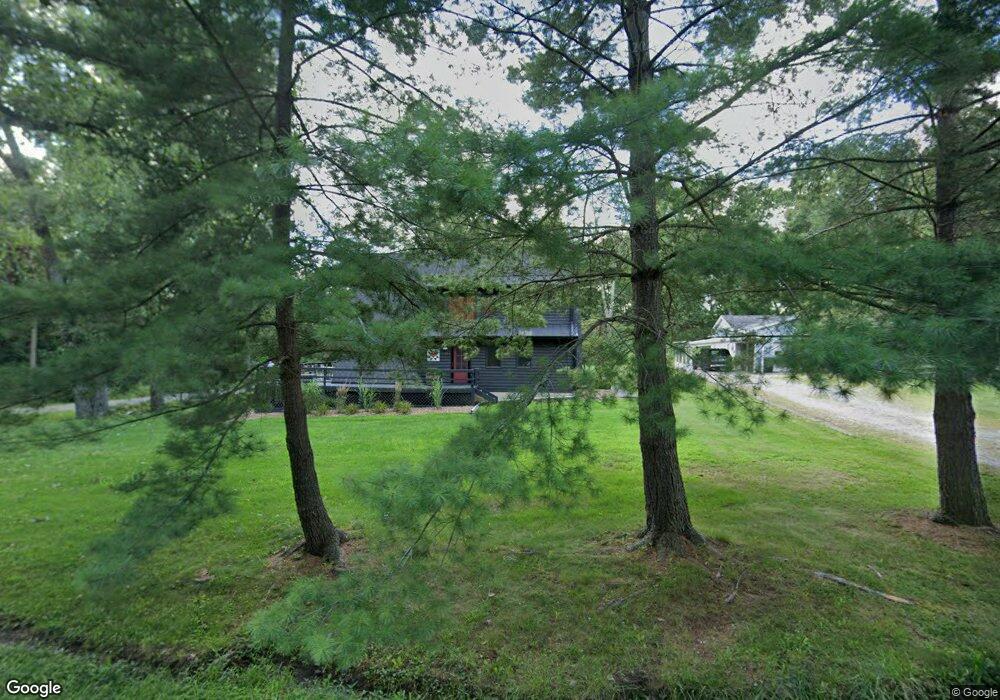
This home is located at 8954 E South Circle Dr, Effingham, IL 62401 and is currently estimated at $264,300, approximately $161 per square foot. 8954 E South Circle Dr is a home located in Effingham County with nearby schools including Beecher City Grade School and Beecher City Junior/Senior High School.
Ownership History
Date
Name
Owned For
Owner Type
Purchase Details
Closed on
Dec 20, 2021
Sold by
Niemerg Collin P
Bought by
Passalacqua Brad and Passalacqua Ginger
Current Estimated Value
Purchase Details
Closed on
Apr 13, 2018
Sold by
Gathe Rollin and Gathe Mary
Bought by
Niemerg Collin P
Home Financials for this Owner
Home Financials are based on the most recent Mortgage that was taken out on this home.
Original Mortgage
$109,600
Interest Rate
4.75%
Mortgage Type
Future Advance Clause Open End Mortgage
Purchase Details
Closed on
Nov 17, 2016
Sold by
Stumeier Derick C and Stumeier Danielle
Bought by
Gathe Rollin and Gathe Mary
Purchase Details
Closed on
Jun 18, 2008
Sold by
Lewis Patrick H
Bought by
Stumeier Derick C and Stumeier Debra Sue
Home Financials for this Owner
Home Financials are based on the most recent Mortgage that was taken out on this home.
Original Mortgage
$105,600
Interest Rate
5.9%
Mortgage Type
Purchase Money Mortgage
Create a Home Valuation Report for This Property
The Home Valuation Report is an in-depth analysis detailing your home's value as well as a comparison with similar homes in the area
Purchase History
| Date | Buyer | Sale Price | Title Company |
|---|---|---|---|
| Passalacqua Brad | -- | None Listed On Document | |
| Niemerg Collin P | $137,000 | The Title Center | |
| Gathe Rollin | $135,000 | None Available | |
| Stumeier Derick C | $132,000 | None Available |
Source: Public Records
Mortgage History
| Date | Status | Borrower | Loan Amount |
|---|---|---|---|
| Previous Owner | Niemerg Collin P | $109,600 | |
| Previous Owner | Stumeier Derick C | $105,600 |
Source: Public Records
Tax History
| Year | Tax Paid | Tax Assessment Tax Assessment Total Assessment is a certain percentage of the fair market value that is determined by local assessors to be the total taxable value of land and additions on the property. | Land | Improvement |
|---|---|---|---|---|
| 2024 | $3,704 | $67,730 | $5,680 | $62,050 |
| 2023 | $3,462 | $61,290 | $5,140 | $56,150 |
| 2022 | $3,358 | $56,750 | $4,760 | $51,990 |
| 2021 | $2,856 | $54,040 | $4,530 | $49,510 |
| 2020 | $2,767 | $51,970 | $4,360 | $47,610 |
| 2019 | $2,707 | $50,450 | $4,230 | $46,220 |
| 2018 | $2,453 | $48,050 | $4,030 | $44,020 |
| 2017 | $2,389 | $47,110 | $3,950 | $43,160 |
| 2016 | $2,413 | $45,080 | $3,780 | $41,300 |
| 2015 | -- | $44,630 | $3,740 | $40,890 |
| 2014 | -- | $44,190 | $3,700 | $40,490 |
| 2013 | -- | $44,190 | $3,700 | $40,490 |
| 2012 | -- | $44,190 | $3,700 | $40,490 |
Source: Public Records
Map
Nearby Homes
- 15052 N 16th Ave
- 14748 N Court 7
- 14689 N Court 6
- 9284 E Court 11
- 15205 N Siemer Rd
- 9219 E Best Ct
- 15482 N Wildwood Dr
- 14744 N Court 1
- 14704 N Court 1
- 15872 N Bluebird Dr
- 15981 N Hillcrest Dr
- 24 N Country Club Rd
- 21 N Country Club Rd
- 13120 Augusta National Dr
- 9 N Country Club Rd
- 8 N Country Club Rd
- 12990 Country Club Rd
- 11107 E Cambridge Ln
- 11020 E Lake Edward Ln
- 11154 E Ravenwood Ct
- 8954 E Circle Dr
- 8840 E Circle Dr
- 8840 E South Circle Dr
- 8832 E Circle Dr
- 8832 E South Circle Dr
- 8832 E South Circle Dr
- 40 3rd Ave
- 14443 N 3rd Ave
- 14443 N 3rd Ave
- 11457 N 4th Ave
- 14427 N 3rd Ave
- 14400 N 3rd Ave
- 14427 N 3rd Ave
- 14471 N 4th Ave
- 14468 N 4th Ave
- 14386 N 3rd Ave
- 9400 E South Circle Dr
- 14350 N 3rd Ave
- 0 5th Ave
- 14350 N 3rd Ave
Your Personal Tour Guide
Ask me questions while you tour the home.