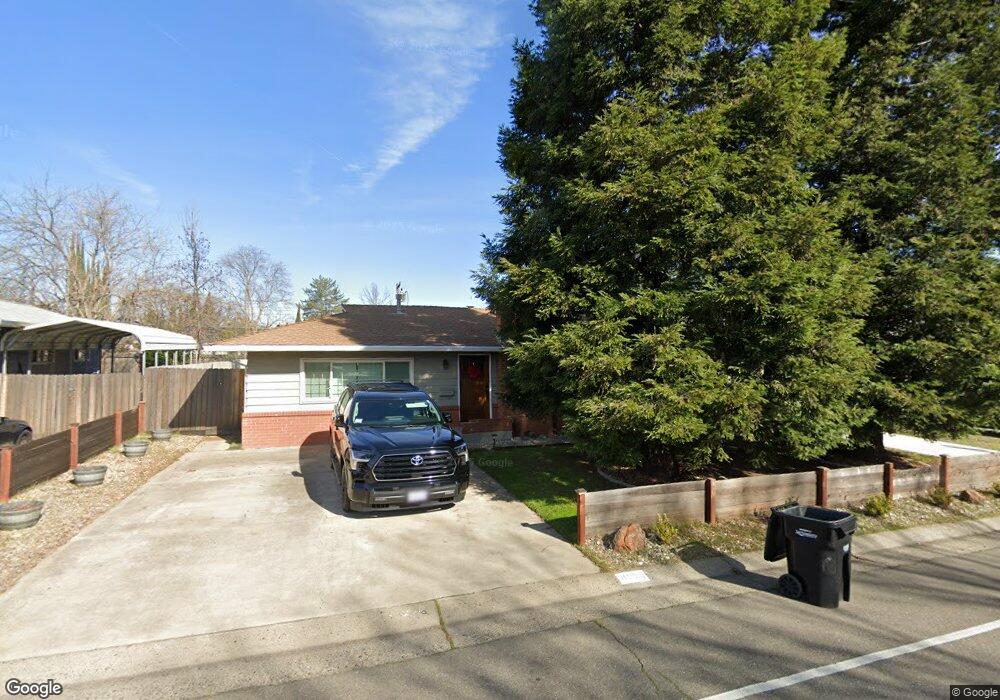
8955 Pershing Ave Orangevale, CA 95662
Estimated Value: $476,089 - $546,000
3
Beds
2
Baths
1,423
Sq Ft
$360/Sq Ft
Est. Value
About This Home
This home is located at 8955 Pershing Ave, Orangevale, CA 95662 and is currently estimated at $511,772, approximately $359 per square foot. 8955 Pershing Ave is a home located in Sacramento County with nearby schools including Pershing Elementary School, Andrew Carnegie Middle School, and Bella Vista High School.
Ownership History
Date
Name
Owned For
Owner Type
Purchase Details
Closed on
May 18, 2006
Sold by
Douglas John Quincy
Bought by
Judd Amy Lyn
Current Estimated Value
Home Financials for this Owner
Home Financials are based on the most recent Mortgage that was taken out on this home.
Original Mortgage
$25,000
Outstanding Balance
$14,529
Interest Rate
6.46%
Mortgage Type
Credit Line Revolving
Estimated Equity
$497,243
Purchase Details
Closed on
Mar 19, 2004
Sold by
Strand James
Bought by
Judd Amy Lyn
Home Financials for this Owner
Home Financials are based on the most recent Mortgage that was taken out on this home.
Original Mortgage
$154,000
Interest Rate
5.57%
Mortgage Type
Purchase Money Mortgage
Purchase Details
Closed on
Oct 14, 1999
Sold by
Strand James
Bought by
Judd Amy Lynn
Home Financials for this Owner
Home Financials are based on the most recent Mortgage that was taken out on this home.
Original Mortgage
$102,575
Interest Rate
6.75%
Create a Home Valuation Report for This Property
The Home Valuation Report is an in-depth analysis detailing your home's value as well as a comparison with similar homes in the area
Home Values in the Area
Average Home Value in this Area
Purchase History
| Date | Buyer | Sale Price | Title Company |
|---|---|---|---|
| Judd Amy Lyn | -- | Financial Title Company | |
| Judd Amy Lyn | -- | Alliance Title Company | |
| Judd Amy Lyn | -- | Alliance Title Company | |
| Judd Amy Lynn | -- | Placer Title Company | |
| Judd Amy Lyn | $114,000 | Placer Title Company |
Source: Public Records
Mortgage History
| Date | Status | Borrower | Loan Amount |
|---|---|---|---|
| Open | Judd Amy Lyn | $25,000 | |
| Closed | Judd Amy Lyn | $154,000 | |
| Closed | Judd Amy Lyn | $102,575 |
Source: Public Records
Tax History
| Year | Tax Paid | Tax Assessment Tax Assessment Total Assessment is a certain percentage of the fair market value that is determined by local assessors to be the total taxable value of land and additions on the property. | Land | Improvement |
|---|---|---|---|---|
| 2025 | $3,806 | $319,041 | $108,350 | $210,691 |
| 2024 | $3,806 | $312,786 | $106,226 | $206,560 |
| 2023 | $3,711 | $306,654 | $104,144 | $202,510 |
| 2022 | $3,692 | $300,642 | $102,102 | $198,540 |
| 2021 | $3,631 | $294,748 | $100,100 | $194,648 |
| 2020 | $3,564 | $291,727 | $99,074 | $192,653 |
| 2019 | $3,493 | $286,008 | $97,132 | $188,876 |
| 2018 | $3,454 | $280,401 | $95,228 | $185,173 |
| 2017 | $3,420 | $274,904 | $93,361 | $181,543 |
| 2016 | $2,942 | $247,617 | $84,090 | $163,527 |
| 2015 | $4,275 | $235,826 | $80,086 | $155,740 |
| 2014 | $2,689 | $226,756 | $77,006 | $149,750 |
Source: Public Records
Map
Nearby Homes
- 8914 Aksarben Dr
- 5817 Husker St
- 6024 Mcneely Way
- 5630 Boltres St
- 8832 Canarsie Ave
- 8805 Jonnie Way
- 8859 Mohawk Way
- 6217 Green Eyes Way
- 8758 Corinne Dr
- 9112 Madison Green Ln Unit 22
- 5326 Flyway Dr
- 8814 Mohawk Way
- 9237 Madison Ave
- 8987 Wickstrom Dr
- 9017 Phoenix Ave
- 8981 Wickstrom Dr
- 8999 Wickstrom Dr
- 8770 Greenback Ln
- 8754 Mellowdawn Way
- 9160 Madison Ave Unit 68
- 8959 Pershing Ave
- 8951 Pershing Ave
- 8948 Aksarben Dr
- 8952 Aksarben Dr
- 8963 Pershing Ave
- 8947 Pershing Ave
- 8944 Aksarben Dr
- 5801 Pecan Ave
- 8956 Pershing Ave
- 8952 Pershing Ave
- 5805 Pecan Ave
- 8940 Aksarben Dr
- 8956 Aksarben Dr
- 8948 Pershing Ave
- 8943 Pershing Ave
- 9000 Pershing Ave
- 5809 Pecan Ave
- 8936 Aksarben Dr
- 8960 Aksarben Dr
- 8944 Pershing Ave
Your Personal Tour Guide
Ask me questions while you tour the home.