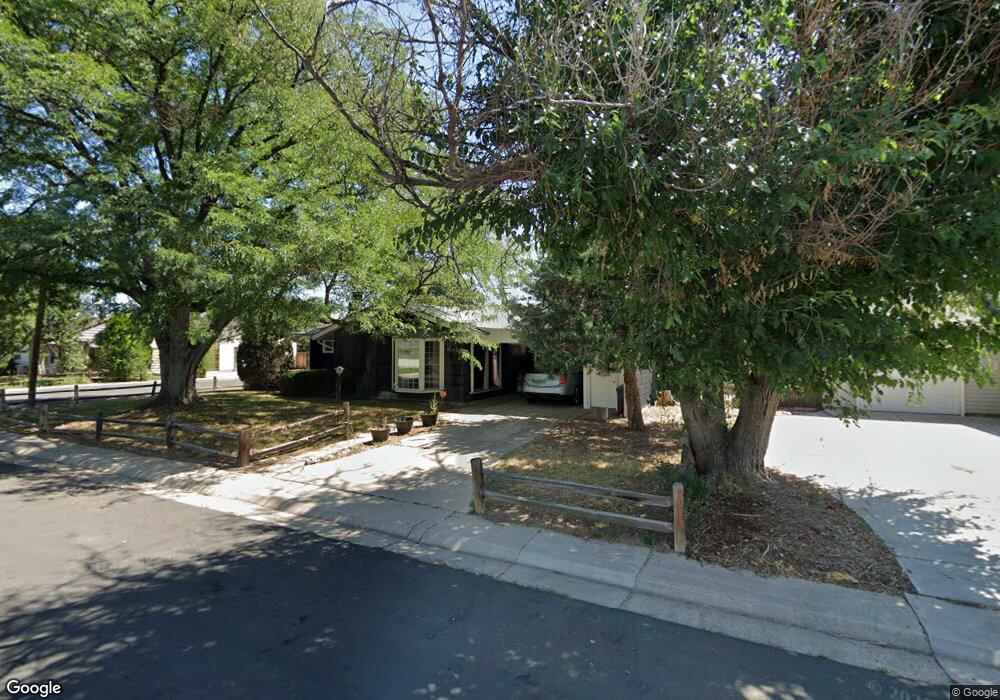
896 Oakland St Aurora, CO 80010
Del Mar Parkway NeighborhoodEstimated Value: $406,903 - $489,000
2
Beds
3
Baths
2,031
Sq Ft
$219/Sq Ft
Est. Value
About This Home
This home is located at 896 Oakland St, Aurora, CO 80010 and is currently estimated at $445,726, approximately $219 per square foot. 896 Oakland St is a home located in Arapahoe County with nearby schools including Kenton Elementary School, Sunnydale Elementary School, and Lincoln Elementary School.
Ownership History
Date
Name
Owned For
Owner Type
Purchase Details
Closed on
Feb 21, 2014
Sold by
Peecher Vonda and Freeland Vonda M
Bought by
Peecher Vonda
Current Estimated Value
Home Financials for this Owner
Home Financials are based on the most recent Mortgage that was taken out on this home.
Original Mortgage
$55,000
Outstanding Balance
$41,676
Interest Rate
4.41%
Mortgage Type
Credit Line Revolving
Estimated Equity
$404,050
Purchase Details
Closed on
Jul 4, 1776
Bought by
Conversion Arapco
Create a Home Valuation Report for This Property
The Home Valuation Report is an in-depth analysis detailing your home's value as well as a comparison with similar homes in the area
Home Values in the Area
Average Home Value in this Area
Purchase History
| Date | Buyer | Sale Price | Title Company |
|---|---|---|---|
| Peecher Vonda | -- | Dri Title & Escrow | |
| Conversion Arapco | -- | -- |
Source: Public Records
Mortgage History
| Date | Status | Borrower | Loan Amount |
|---|---|---|---|
| Open | Peecher Vonda | $55,000 |
Source: Public Records
Tax History Compared to Growth
Tax History
| Year | Tax Paid | Tax Assessment Tax Assessment Total Assessment is a certain percentage of the fair market value that is determined by local assessors to be the total taxable value of land and additions on the property. | Land | Improvement |
|---|---|---|---|---|
| 2024 | $1,778 | $25,829 | -- | -- |
| 2023 | $1,778 | $25,829 | $0 | $0 |
| 2022 | $1,419 | $21,080 | $0 | $0 |
| 2021 | $1,465 | $21,080 | $0 | $0 |
| 2020 | $1,311 | $19,742 | $0 | $0 |
| 2019 | $1,304 | $19,742 | $0 | $0 |
| 2018 | $856 | $15,300 | $0 | $0 |
| 2017 | $745 | $15,300 | $0 | $0 |
| 2016 | $659 | $14,033 | $0 | $0 |
| 2015 | $636 | $14,033 | $0 | $0 |
| 2014 | -- | $7,657 | $0 | $0 |
| 2013 | -- | $9,050 | $0 | $0 |
Source: Public Records
Map
Nearby Homes