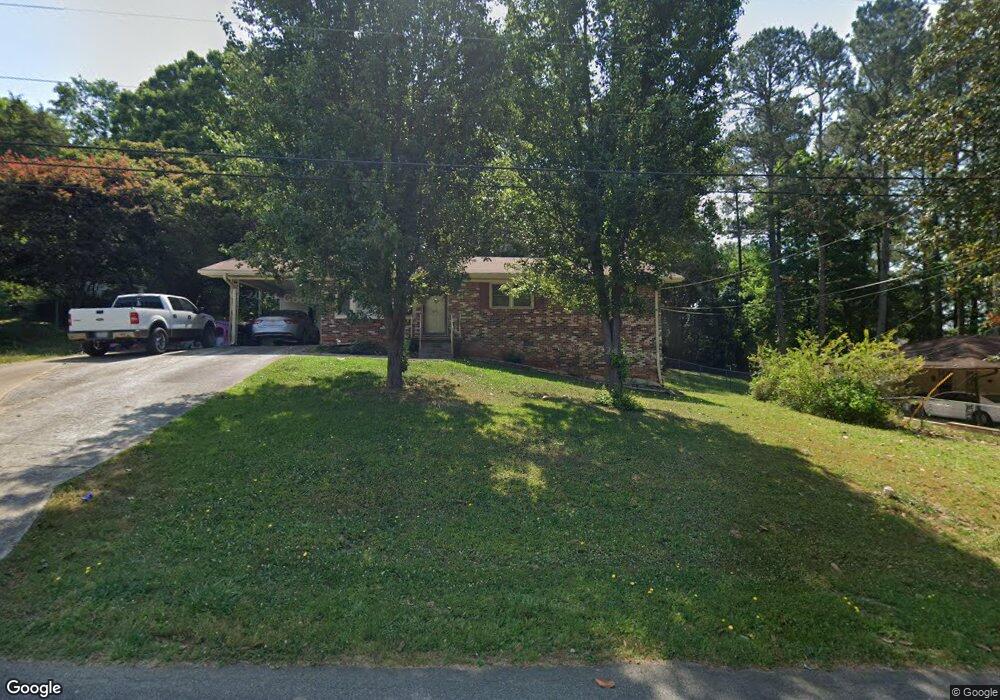
897 Poplar St Toccoa, GA 30577
Estimated Value: $186,704 - $197,000
3
Beds
2
Baths
1,100
Sq Ft
$175/Sq Ft
Est. Value
About This Home
This home is located at 897 Poplar St, Toccoa, GA 30577 and is currently estimated at $192,176, approximately $174 per square foot. 897 Poplar St is a home located in Stephens County with nearby schools including Stephens County High School.
Ownership History
Date
Name
Owned For
Owner Type
Purchase Details
Closed on
Oct 14, 2022
Sold by
Jtre Llc
Bought by
Duong Calvin L and Duong Lang
Current Estimated Value
Purchase Details
Closed on
Sep 12, 2022
Sold by
Cross Rodger L
Bought by
Jtre Llc
Purchase Details
Closed on
Jan 2, 2007
Sold by
Not Provided
Bought by
Cross Rodger and Cross April
Purchase Details
Closed on
Jul 5, 2006
Sold by
Blackwell Kendra
Bought by
Chase Home Finance Llc
Purchase Details
Closed on
Jul 29, 2005
Sold by
Pulliam Joe D
Bought by
Blackwell Kendra
Home Financials for this Owner
Home Financials are based on the most recent Mortgage that was taken out on this home.
Original Mortgage
$60,000
Interest Rate
9.72%
Mortgage Type
New Conventional
Purchase Details
Closed on
May 1, 1998
Bought by
<Buyer Info Not Present>
Purchase Details
Closed on
Apr 1, 1995
Bought by
<Buyer Info Not Present>
Create a Home Valuation Report for This Property
The Home Valuation Report is an in-depth analysis detailing your home's value as well as a comparison with similar homes in the area
Purchase History
| Date | Buyer | Sale Price | Title Company |
|---|---|---|---|
| Duong Calvin L | $142,500 | -- | |
| Jtre Llc | $84,000 | -- | |
| Cross Rodger | $74,500 | -- | |
| Cross Rodger | $74,500 | -- | |
| Chase Home Finance Llc | $63,697 | -- | |
| Blackwell Kendra | $85,000 | -- | |
| <Buyer Info Not Present> | $65,800 | -- | |
| <Buyer Info Not Present> | $57,000 | -- |
Source: Public Records
Mortgage History
| Date | Status | Borrower | Loan Amount |
|---|---|---|---|
| Previous Owner | Blackwell Kendra | $60,000 | |
| Previous Owner | Blackwell Kendra | $25,000 |
Source: Public Records
Tax History
| Year | Tax Paid | Tax Assessment Tax Assessment Total Assessment is a certain percentage of the fair market value that is determined by local assessors to be the total taxable value of land and additions on the property. | Land | Improvement |
|---|---|---|---|---|
| 2025 | $2,300 | $65,928 | $2,274 | $63,654 |
| 2024 | $1,556 | $43,648 | $2,274 | $41,374 |
| 2023 | $1,235 | $40,561 | $2,274 | $38,287 |
| 2022 | $810 | $27,223 | $2,274 | $24,949 |
| 2021 | $769 | $24,578 | $2,274 | $22,304 |
| 2020 | $792 | $25,082 | $2,274 | $22,808 |
| 2019 | $795 | $25,082 | $2,274 | $22,808 |
| 2018 | $795 | $25,076 | $2,268 | $22,808 |
| 2017 | $808 | $25,076 | $2,268 | $22,808 |
| 2016 | $795 | $25,076 | $2,268 | $22,807 |
| 2015 | $852 | $25,658 | $2,268 | $23,390 |
| 2014 | $866 | $25,658 | $2,268 | $23,390 |
| 2013 | -- | $26,043 | $2,268 | $23,774 |
Source: Public Records
Map
Nearby Homes
- 526 Poplar St
- 372 Hilltop Way
- 820 Collier Rd
- 704 Skyline Dr
- 926 Skyline Dr
- 0 Valley Dr Unit 10701357
- 475 Hilltop Way
- 208 Cherry St
- 253 Stancil Dr
- 0 Stephen Dr Unit 10710969
- 0 Stephen Dr Unit 10710891
- 158 Pebble Creek Dr
- 93 Hickory Cir
- 122 King St
- 103 Old Liberty Hill Rd
- 43 Sycamore Dr
- 9 Poplar St
- 27 Hilltop Ln
- 1037 S Pond St
- 943 S Pond St
- 917 Poplar St
- 877 Poplar St
- 131 Poplar Way
- 900 Poplar St
- 207 Poplar Trail
- 859 Poplar St
- 273 Poplar Trail
- 488 Poplar St
- 231 Poplar Trail
- 124 Poplar Way
- 200 Poplar Trail
- 852 Poplar St
- 109 Poplar Trail
- 833 Poplar St
- 102 Poplar Way
- 228 Poplar Trail
- 118 Poplar Trail
- 118 Poplar Trail
- 96 Poplar Ct
- 836 Poplar St
Your Personal Tour Guide
Ask me questions while you tour the home.