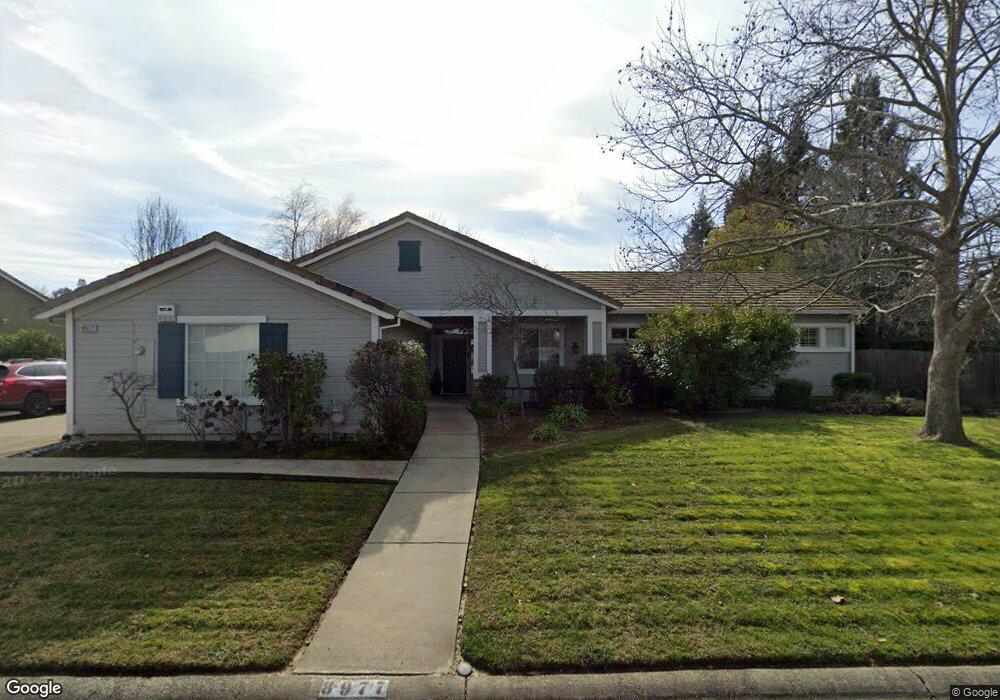
8977 Cape Windham Place Orangevale, CA 95662
Estimated Value: $779,000 - $908,000
4
Beds
3
Baths
2,244
Sq Ft
$365/Sq Ft
Est. Value
About This Home
This home is located at 8977 Cape Windham Place, Orangevale, CA 95662 and is currently estimated at $819,610, approximately $365 per square foot. 8977 Cape Windham Place is a home located in Sacramento County with nearby schools including Ottomon Way Elementary School, Louis Pasteur Fundamental Middle School, and Casa Roble Fundamental High School.
Ownership History
Date
Name
Owned For
Owner Type
Purchase Details
Closed on
Nov 13, 2015
Sold by
Prints Andrew C and Prints Lisa C
Bought by
Andrew & Lisa Prints Living Trust
Current Estimated Value
Purchase Details
Closed on
Mar 8, 1999
Sold by
Robins Leonard A and Robins Joyce
Bought by
Prints Andrew C and Prints Lisa C
Home Financials for this Owner
Home Financials are based on the most recent Mortgage that was taken out on this home.
Original Mortgage
$170,250
Outstanding Balance
$41,028
Interest Rate
6.7%
Estimated Equity
$778,582
Purchase Details
Closed on
Dec 24, 1997
Sold by
M J Brock & Sons Inc
Bought by
Robins Leonard A and Robins Joyce
Home Financials for this Owner
Home Financials are based on the most recent Mortgage that was taken out on this home.
Original Mortgage
$173,550
Interest Rate
3.95%
Create a Home Valuation Report for This Property
The Home Valuation Report is an in-depth analysis detailing your home's value as well as a comparison with similar homes in the area
Home Values in the Area
Average Home Value in this Area
Purchase History
| Date | Buyer | Sale Price | Title Company |
|---|---|---|---|
| Andrew & Lisa Prints Living Trust | -- | None Available | |
| Prints Andrew C | $227,000 | Stewart Title | |
| Robins Leonard A | $217,000 | Stewart Title |
Source: Public Records
Mortgage History
| Date | Status | Borrower | Loan Amount |
|---|---|---|---|
| Open | Prints Andrew C | $170,250 | |
| Previous Owner | Robins Leonard A | $173,550 | |
| Closed | Prints Andrew C | $45,400 |
Source: Public Records
Tax History
| Year | Tax Paid | Tax Assessment Tax Assessment Total Assessment is a certain percentage of the fair market value that is determined by local assessors to be the total taxable value of land and additions on the property. | Land | Improvement |
|---|---|---|---|---|
| 2025 | $4,605 | $393,499 | $94,049 | $299,450 |
| 2024 | $4,605 | $385,784 | $92,205 | $293,579 |
| 2023 | $4,481 | $378,221 | $90,398 | $287,823 |
| 2022 | $4,456 | $370,806 | $88,626 | $282,180 |
| 2021 | $4,388 | $363,537 | $86,889 | $276,648 |
| 2020 | $4,306 | $359,811 | $85,999 | $273,812 |
| 2019 | $4,219 | $352,757 | $84,313 | $268,444 |
| 2018 | $4,170 | $345,841 | $82,660 | $263,181 |
| 2017 | $4,128 | $339,061 | $81,040 | $258,021 |
| 2016 | $3,857 | $332,413 | $79,451 | $252,962 |
| 2015 | $3,791 | $327,421 | $78,258 | $249,163 |
| 2014 | $3,711 | $321,009 | $76,726 | $244,283 |
Source: Public Records
Map
Nearby Homes
- 9065 Wickstrom Dr
- 9028 Wickstrom Dr
- 9011 Wickstrom Dr
- 9022 Wickstrom Dr
- 8999 Wickstrom Dr
- 8981 Wickstrom Dr
- 8987 Wickstrom Dr
- 8993 Wickstrom Dr
- 9077 Westeria Way
- 8924 Maple Hill Ln
- 8907 Maple Hill Ln
- 8875 Wickstrom Dr
- 9008 Clarissa Dr
- 9169 Renee Ann St
- 6422 Hazel Ave
- 6600 Rosa Prado Ct
- 6805 Chestnut Ave
- 8856 Venikov Place
- 9340 Orangevale Ave Unit 26
- 9340 Orangevale Ave Unit 27
- 8973 Cape Windham Place
- 8981 Cape Windham Place
- 8990 Cape Windham Place
- 8974 Cape Windham Place
- 6415 Filbert Ave
- 6349 Filbert Ave
- 8969 Cape Windham Place
- 8994 Cape Windham Place
- 6345 Filbert Ave
- 8965 Cape Windham Place
- 6425 Filbert Ave
- 6331 Filbert Ave
- 8961 Cape Windham Place
- 8958 Cape Windham Place
- 6336 Old Orchard Way
- 6400 Old Orchard Way
- 8920 Cape Windham Place
- 6350 Filbert Ave
- 6350 Filbert Ave
- 6330 Old Orchard Way
Your Personal Tour Guide
Ask me questions while you tour the home.