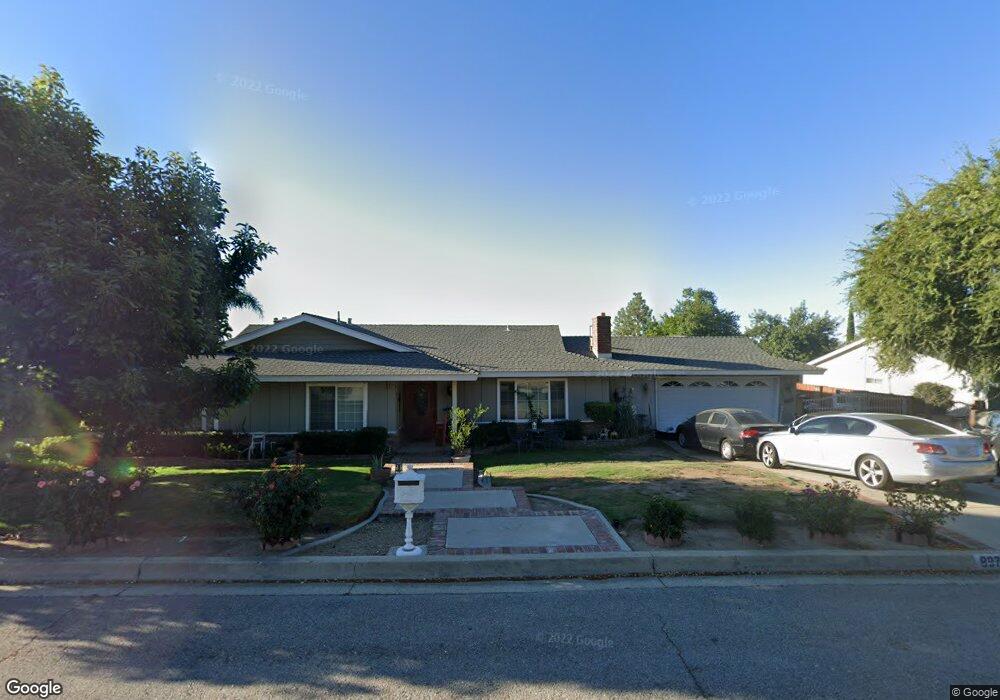
8979 Whirlaway Ct Rancho Cucamonga, CA 91737
Estimated Value: $1,189,808 - $1,422,000
4
Beds
2
Baths
2,893
Sq Ft
$445/Sq Ft
Est. Value
About This Home
This home is located at 8979 Whirlaway Ct, Rancho Cucamonga, CA 91737 and is currently estimated at $1,287,202, approximately $444 per square foot. 8979 Whirlaway Ct is a home located in San Bernardino County with nearby schools including Floyd M. Stork Elementary, Alta Loma Junior High, and Los Osos High.
Ownership History
Date
Name
Owned For
Owner Type
Purchase Details
Closed on
Mar 31, 2005
Sold by
Haddad Laila and Haddad Laila S
Bought by
Haddad Antoine F and Haddad Laila S
Current Estimated Value
Purchase Details
Closed on
Jan 14, 2002
Sold by
Ccg Ontario Llc
Bought by
Catellus Commercial Group Llc
Purchase Details
Closed on
Jan 2, 2001
Sold by
Eide John K and Eide Melinda M
Bought by
Haddad Laila
Home Financials for this Owner
Home Financials are based on the most recent Mortgage that was taken out on this home.
Original Mortgage
$283,200
Interest Rate
7.65%
Purchase Details
Closed on
Dec 6, 2000
Sold by
Haddad Antoine
Bought by
Haddad Laila
Home Financials for this Owner
Home Financials are based on the most recent Mortgage that was taken out on this home.
Original Mortgage
$283,200
Interest Rate
7.65%
Purchase Details
Closed on
Aug 13, 1993
Sold by
Davis Karl D and Davis Kimberly A
Bought by
Eide John K and Eide Melinda M
Home Financials for this Owner
Home Financials are based on the most recent Mortgage that was taken out on this home.
Original Mortgage
$256,950
Interest Rate
4.87%
Create a Home Valuation Report for This Property
The Home Valuation Report is an in-depth analysis detailing your home's value as well as a comparison with similar homes in the area
Home Values in the Area
Average Home Value in this Area
Purchase History
| Date | Buyer | Sale Price | Title Company |
|---|---|---|---|
| Haddad Antoine F | -- | -- | |
| Catellus Commercial Group Llc | -- | Chicago Title Co | |
| Haddad Laila | $354,000 | First American Title Ins Co | |
| Haddad Laila | -- | First American Title Ins Co | |
| Eide John K | $285,500 | Chicago Title Co |
Source: Public Records
Mortgage History
| Date | Status | Borrower | Loan Amount |
|---|---|---|---|
| Previous Owner | Haddad Laila | $283,200 | |
| Previous Owner | Eide John K | $256,950 |
Source: Public Records
Tax History Compared to Growth
Tax History
| Year | Tax Paid | Tax Assessment Tax Assessment Total Assessment is a certain percentage of the fair market value that is determined by local assessors to be the total taxable value of land and additions on the property. | Land | Improvement |
|---|---|---|---|---|
| 2025 | $5,774 | $533,425 | $180,822 | $352,603 |
| 2024 | $5,774 | $522,965 | $177,276 | $345,689 |
| 2023 | $5,644 | $512,711 | $173,800 | $338,911 |
| 2022 | $5,630 | $502,658 | $170,392 | $332,266 |
| 2021 | $5,628 | $492,802 | $167,051 | $325,751 |
| 2020 | $5,396 | $487,749 | $165,338 | $322,411 |
| 2019 | $5,458 | $478,185 | $162,096 | $316,089 |
| 2018 | $5,336 | $468,809 | $158,918 | $309,891 |
| 2017 | $5,092 | $459,617 | $155,802 | $303,815 |
| 2016 | $4,954 | $450,605 | $152,747 | $297,858 |
| 2015 | $4,923 | $443,837 | $150,453 | $293,384 |
| 2014 | $4,784 | $435,143 | $147,506 | $287,637 |
Source: Public Records
Map
Nearby Homes
- 8915 Appaloosa Ct
- 8967 Citation Ct
- 5338 Falling Tree Ln
- 8798 Justify Dr
- 9239 Camellia Ct
- 9227 Camellia Ct
- 9230 Camellia Ct
- 9220 Camellia Ct
- 9210 Camellia Ct
- 9209 Camellia Ct
- 9201 Camellia Ct
- 9179 Hidden Farm Rd
- 5291 Carnelian St
- 9066 Laramie Dr
- 5327 Topaz St
- 8911 Mustang Rd
- 5830 Emerald St
- 8327 La Senda Rd
- 8326 La Senda Rd
- 0 Bella Vista Dr Unit CV25069957
- 8991 Whirlaway Ct
- 8961 Whirlaway Ct
- 8949 Whirlaway Ct
- 8974 Camellia Ct
- 8960 Camellia Ct
- 8984 Camellia Ct
- 8944 Camellia Ct
- 8972 Whirlaway Ct
- 8986 Whirlaway Ct
- 8958 Whirlaway Ct
- 8998 Whirlaway Ct
- 8931 Whirlaway Ct
- 9000 Camellia Ct
- 8928 Camellia Ct
- 8944 Whirlaway Ct
- 9023 Whirlaway Ct
- 8929 Whirlaway Ct
- 8915 Whirlaway Ct
- 9016 Whirlaway Ct