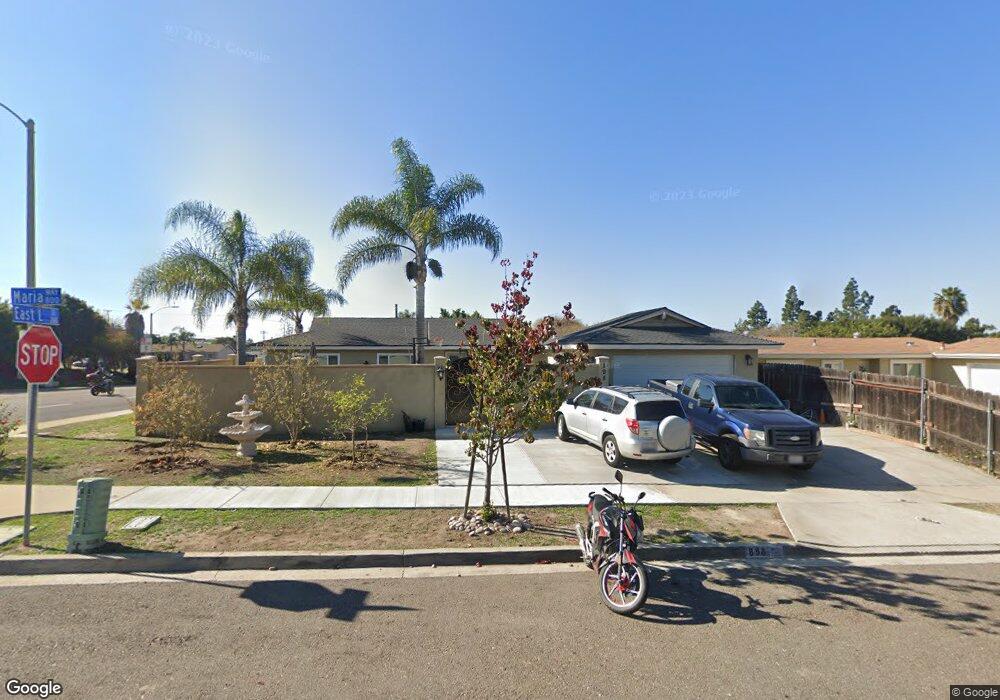
898 Maria Way Chula Vista, CA 91911
Hilltop NeighborhoodEstimated Value: $771,785 - $838,000
3
Beds
2
Baths
1,450
Sq Ft
$560/Sq Ft
Est. Value
About This Home
This home is located at 898 Maria Way, Chula Vista, CA 91911 and is currently estimated at $811,446, approximately $559 per square foot. 898 Maria Way is a home located in San Diego County with nearby schools including Cook Elementary School, Hilltop Middle School, and Hilltop Senior High School.
Ownership History
Date
Name
Owned For
Owner Type
Purchase Details
Closed on
Jun 14, 2019
Sold by
Duval Mark A and Duval Jenalyn C
Bought by
Herrera Patricia and Mendez Alfonso
Current Estimated Value
Home Financials for this Owner
Home Financials are based on the most recent Mortgage that was taken out on this home.
Original Mortgage
$449,880
Outstanding Balance
$394,753
Interest Rate
4%
Mortgage Type
New Conventional
Estimated Equity
$416,693
Purchase Details
Closed on
May 27, 2004
Sold by
Martin Matthew J
Bought by
Martin Matthew J
Purchase Details
Closed on
May 5, 1999
Sold by
Greenley Elizabeth
Bought by
Duval Mark A
Home Financials for this Owner
Home Financials are based on the most recent Mortgage that was taken out on this home.
Original Mortgage
$185,000
Interest Rate
6.86%
Mortgage Type
VA
Purchase Details
Closed on
Nov 9, 1998
Sold by
Patrick Lynch and Patrick Marguerite L
Bought by
Greenley Elizabeth
Purchase Details
Closed on
Nov 1, 1989
Purchase Details
Closed on
Sep 2, 1988
Create a Home Valuation Report for This Property
The Home Valuation Report is an in-depth analysis detailing your home's value as well as a comparison with similar homes in the area
Home Values in the Area
Average Home Value in this Area
Purchase History
| Date | Buyer | Sale Price | Title Company |
|---|---|---|---|
| Herrera Patricia | $489,000 | Fidelity Natl Ttl San Diego | |
| Martin Matthew J | -- | -- | |
| Duval Mark A | $189,000 | First American Title Ins Co | |
| Greenley Elizabeth | $175,000 | California Title Company | |
| -- | $159,500 | -- | |
| -- | $142,000 | -- |
Source: Public Records
Mortgage History
| Date | Status | Borrower | Loan Amount |
|---|---|---|---|
| Open | Herrera Patricia | $449,880 | |
| Previous Owner | Duval Mark A | $185,000 |
Source: Public Records
Tax History Compared to Growth
Tax History
| Year | Tax Paid | Tax Assessment Tax Assessment Total Assessment is a certain percentage of the fair market value that is determined by local assessors to be the total taxable value of land and additions on the property. | Land | Improvement |
|---|---|---|---|---|
| 2025 | $6,382 | $553,972 | $257,850 | $296,122 |
| 2024 | $6,382 | $543,111 | $252,795 | $290,316 |
| 2023 | $6,296 | $532,463 | $247,839 | $284,624 |
| 2022 | $6,115 | $522,024 | $242,980 | $279,044 |
| 2021 | $5,883 | $503,946 | $230,373 | $273,573 |
| 2020 | $5,742 | $498,779 | $228,011 | $270,768 |
| 2019 | $3,048 | $265,175 | $121,222 | $143,953 |
| 2018 | $3,142 | $259,977 | $118,846 | $141,131 |
| 2017 | $2,939 | $254,880 | $116,516 | $138,364 |
| 2016 | $2,870 | $249,883 | $114,232 | $135,651 |
| 2015 | $2,829 | $246,131 | $112,517 | $133,614 |
| 2014 | $2,783 | $241,310 | $110,313 | $130,997 |
Source: Public Records
Map
Nearby Homes
- 158 E L St
- 859 Tamayo Dr Unit 2
- 859 Tamayo Dr Unit 1
- 835 Tamayo Dr Unit 6
- 814 Tamayo Dr Unit 2
- 953 Barrett Ave
- 62 E Palomar Dr
- 52 E L St
- 202 E J St
- 826 Floyd Ave
- 647 Claire Ave
- 838 David Dr
- 514 Avenida Centro Unit 105
- 514 Avenida Centro Unit 114
- 586 88 Roosevelt St
- 1184 Monterey Place
- 620 Telegraph Canyon Rd Unit C
- 112 Country Club Dr
- 589 E J St
- 1267 Melrose Ave