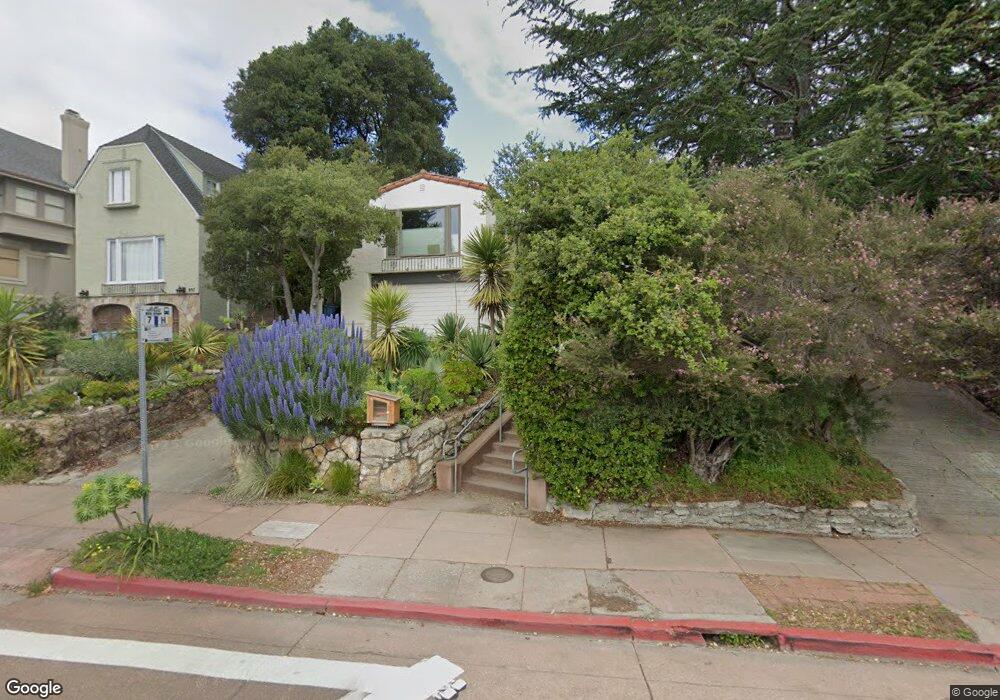
899 Arlington Ave Berkeley, CA 94707
Berkeley Hills NeighborhoodEstimated Value: $2,025,132 - $2,230,000
4
Beds
2
Baths
2,132
Sq Ft
$1,008/Sq Ft
Est. Value
About This Home
This home is located at 899 Arlington Ave, Berkeley, CA 94707 and is currently estimated at $2,150,033, approximately $1,008 per square foot. 899 Arlington Ave is a home located in Alameda County with nearby schools including Thousand Oaks Elementary School, Berkeley Arts Magnet at Whittier School, and Ruth Acty Elementary.
Ownership History
Date
Name
Owned For
Owner Type
Purchase Details
Closed on
Aug 13, 2018
Sold by
Snibbe Scott S and Girshick Ahna
Bought by
Snibbe Scott Sona and Girshick Ahna Reza
Current Estimated Value
Purchase Details
Closed on
Nov 9, 2017
Sold by
Gusick Spencer
Bought by
Snibbe Scott S and Girshick Ahna
Home Financials for this Owner
Home Financials are based on the most recent Mortgage that was taken out on this home.
Original Mortgage
$1,100,000
Outstanding Balance
$921,748
Interest Rate
3.85%
Mortgage Type
New Conventional
Estimated Equity
$1,228,285
Purchase Details
Closed on
Apr 22, 2015
Sold by
Villagran Lisa
Bought by
Gusick Spencer
Home Financials for this Owner
Home Financials are based on the most recent Mortgage that was taken out on this home.
Original Mortgage
$1,083,750
Interest Rate
3.5%
Mortgage Type
Adjustable Rate Mortgage/ARM
Purchase Details
Closed on
Mar 30, 2015
Sold by
Berger Shoshana and Berger Maya
Bought by
Gusick Spencer
Home Financials for this Owner
Home Financials are based on the most recent Mortgage that was taken out on this home.
Original Mortgage
$1,083,750
Interest Rate
3.5%
Mortgage Type
Adjustable Rate Mortgage/ARM
Purchase Details
Closed on
Apr 23, 2013
Sold by
Berger Stanley A
Bought by
Berger Stanley A and Stanley Berger Living Trust
Home Financials for this Owner
Home Financials are based on the most recent Mortgage that was taken out on this home.
Original Mortgage
$522,000
Interest Rate
3.47%
Mortgage Type
New Conventional
Purchase Details
Closed on
Mar 12, 2013
Sold by
Fain Beth H
Bought by
Berger Stanley A
Home Financials for this Owner
Home Financials are based on the most recent Mortgage that was taken out on this home.
Original Mortgage
$522,000
Interest Rate
3.47%
Mortgage Type
New Conventional
Purchase Details
Closed on
Feb 28, 2013
Sold by
Berger Stanley A and Stanley Berger Living Trust
Bought by
Berger Stanley A
Home Financials for this Owner
Home Financials are based on the most recent Mortgage that was taken out on this home.
Original Mortgage
$522,000
Interest Rate
3.47%
Mortgage Type
New Conventional
Purchase Details
Closed on
Dec 11, 2009
Sold by
Berger Stanley A
Bought by
Berger Stanley A and Stanley Berger Living Trust
Purchase Details
Closed on
Mar 9, 2009
Sold by
Berger Stanley A
Bought by
Berger Stanley A and Stanley Berger Living Trust
Create a Home Valuation Report for This Property
The Home Valuation Report is an in-depth analysis detailing your home's value as well as a comparison with similar homes in the area
Home Values in the Area
Average Home Value in this Area
Purchase History
| Date | Buyer | Sale Price | Title Company |
|---|---|---|---|
| Snibbe Scott Sona | -- | None Available | |
| Snibbe Scott S | $1,600,000 | Old Republic Title Company | |
| Gusick Spencer | -- | Chicago Title Company | |
| Gusick Spencer | $1,445,000 | Chicago Title Company | |
| Berger Stanley A | -- | None Available | |
| Berger Stanley A | -- | Equity Title | |
| Berger Stanley A | -- | None Available | |
| Berger Stanley A | -- | None Available | |
| Berger Stanley A | -- | None Available |
Source: Public Records
Mortgage History
| Date | Status | Borrower | Loan Amount |
|---|---|---|---|
| Open | Snibbe Scott S | $1,100,000 | |
| Previous Owner | Gusick Spencer | $1,083,750 | |
| Previous Owner | Berger Stanley A | $522,000 | |
| Previous Owner | Berger Stanley A | $522,000 |
Source: Public Records
Tax History
| Year | Tax Paid | Tax Assessment Tax Assessment Total Assessment is a certain percentage of the fair market value that is determined by local assessors to be the total taxable value of land and additions on the property. | Land | Improvement |
|---|---|---|---|---|
| 2025 | $25,255 | $1,813,495 | $546,148 | $1,274,347 |
| 2024 | $25,255 | $1,777,800 | $535,440 | $1,249,360 |
| 2023 | $24,760 | $1,749,807 | $524,942 | $1,224,865 |
| 2022 | $24,378 | $1,708,503 | $514,651 | $1,200,852 |
| 2021 | $24,479 | $1,674,871 | $504,561 | $1,177,310 |
| 2020 | $23,297 | $1,664,640 | $499,392 | $1,165,248 |
| 2019 | $22,530 | $1,632,000 | $489,600 | $1,142,400 |
| 2018 | $22,191 | $1,600,000 | $480,000 | $1,120,000 |
| 2017 | $21,708 | $1,496,368 | $448,910 | $1,047,458 |
| 2016 | $20,101 | $1,467,035 | $440,110 | $1,026,925 |
| 2015 | $7,474 | $439,093 | $361,271 | $77,822 |
| 2014 | -- | $430,494 | $354,196 | $76,298 |
Source: Public Records
Map
Nearby Homes
- 813 San Diego Rd
- 1983 Yosemite Rd
- 765 San Diego Rd
- 938 San Benito Rd
- 758 Spruce St
- 1950 Hopkins St
- 1858 San Lorenzo Ave
- 777 Cragmont Ave
- 1004 Cragmont Ave
- 2121 Eunice St
- 1741 Sonoma Ave
- 589 San Luis Rd
- 962 Regal Rd
- 614 Cragmont Ave
- 2315 Eunice St
- 483 Boynton Ave
- 753 Peralta Ave
- 450 Vermont Ave
- 491 Vincente Ave
- 1106 Cragmont Ave
- 897 Arlington Ave
- 12 Indian Rock Path
- 901 Arlington Ave
- 895 Arlington Ave
- 16 Indian Rock Path
- 889 Arlington Ave
- 915 Arlington Ave
- 8 Indian Rock Path
- 21 San Mateo Rd
- 15 San Mateo Rd
- 7 San Mateo Rd
- 900 Arlington Ave
- 906 Arlington Ave
- 883 Arlington Ave
- 931 Arlington Ave
- 912 Arlington Ave
- 892 Arlington Ave
- 31 San Mateo Rd
- 6 Indian Rock Path
- 918 Arlington Ave
Your Personal Tour Guide
Ask me questions while you tour the home.