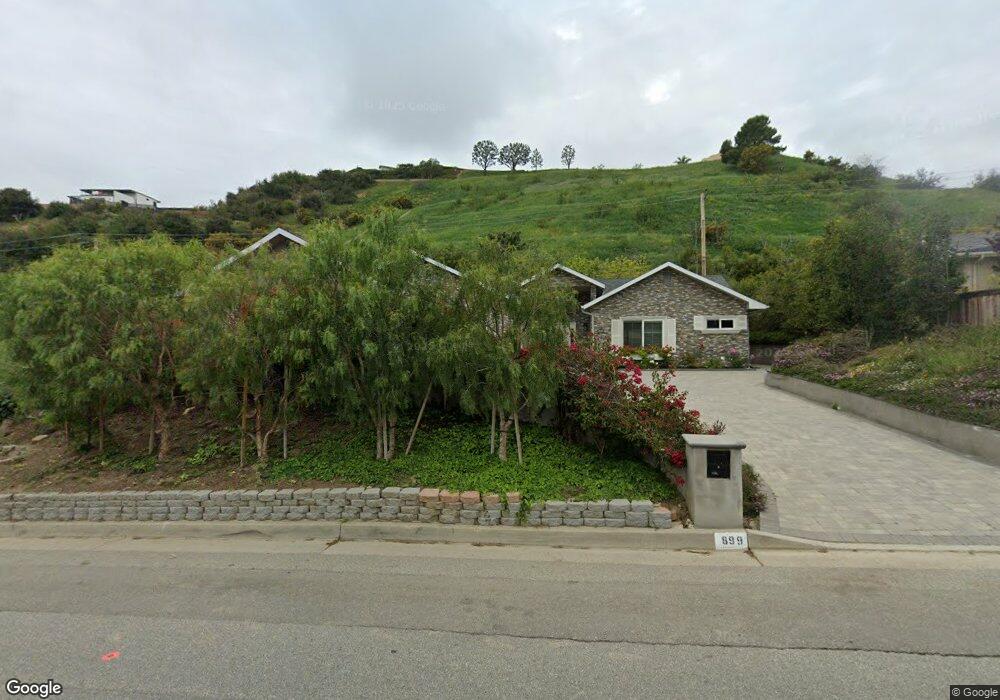
899 Via Arroyo Ventura, CA 93003
Poinsettia NeighborhoodEstimated Value: $1,280,000 - $1,693,000
3
Beds
3
Baths
2,190
Sq Ft
$653/Sq Ft
Est. Value
About This Home
This home is located at 899 Via Arroyo, Ventura, CA 93003 and is currently estimated at $1,430,785, approximately $653 per square foot. 899 Via Arroyo is a home located in Ventura County with nearby schools including Poinsettia Elementary School, Cabrillo Middle School, and Ventura High School.
Ownership History
Date
Name
Owned For
Owner Type
Purchase Details
Closed on
Jan 25, 2010
Sold by
Scott Judith S
Bought by
Scott Judith S
Current Estimated Value
Purchase Details
Closed on
Mar 12, 2002
Sold by
Scott Judith S and Scott Judy S
Bought by
Scott Judith S
Purchase Details
Closed on
Mar 14, 1995
Sold by
Horn Merlin W and Horn Dorothy L
Bought by
Scott Judy S
Home Financials for this Owner
Home Financials are based on the most recent Mortgage that was taken out on this home.
Original Mortgage
$154,350
Interest Rate
8.77%
Purchase Details
Closed on
Mar 3, 1995
Sold by
Christman John L and Christman Kathleen
Bought by
Bernstein Michael P and Bernstein Joan M
Home Financials for this Owner
Home Financials are based on the most recent Mortgage that was taken out on this home.
Original Mortgage
$154,350
Interest Rate
8.77%
Create a Home Valuation Report for This Property
The Home Valuation Report is an in-depth analysis detailing your home's value as well as a comparison with similar homes in the area
Home Values in the Area
Average Home Value in this Area
Purchase History
| Date | Buyer | Sale Price | Title Company |
|---|---|---|---|
| Scott Judith S | -- | None Available | |
| Scott Judith S | -- | None Available | |
| Scott Judith S | -- | -- | |
| Scott Judy S | $229,000 | Chicago Title Company | |
| Bernstein Michael P | $779,500 | Chicago Title Co |
Source: Public Records
Mortgage History
| Date | Status | Borrower | Loan Amount |
|---|---|---|---|
| Closed | Scott Judy S | $154,350 | |
| Previous Owner | Bernstein Michael P | $631,600 |
Source: Public Records
Tax History Compared to Growth
Tax History
| Year | Tax Paid | Tax Assessment Tax Assessment Total Assessment is a certain percentage of the fair market value that is determined by local assessors to be the total taxable value of land and additions on the property. | Land | Improvement |
|---|---|---|---|---|
| 2025 | $4,492 | $421,523 | $209,950 | $211,573 |
| 2024 | $4,492 | $413,258 | $205,833 | $207,425 |
| 2023 | $4,441 | $405,155 | $201,797 | $203,358 |
| 2022 | $4,127 | $397,211 | $197,840 | $199,371 |
| 2021 | $3,659 | $351,066 | $193,961 | $157,105 |
| 2020 | $2,731 | $261,082 | $191,973 | $69,109 |
| 2019 | $1,456 | $141,155 | $141,155 | $0 |
| 2018 | $1,430 | $138,388 | $138,388 | $0 |
| 2017 | $3,602 | $343,710 | $180,901 | $162,809 |
| 2016 | $3,538 | $336,971 | $177,354 | $159,617 |
| 2015 | $3,481 | $331,911 | $174,691 | $157,220 |
| 2014 | $3,431 | $325,412 | $171,270 | $154,142 |
Source: Public Records
Map
Nearby Homes
- 259 Via Pasito
- 872 Via Arroyo
- 1018 Via Arroyo
- 708 Skyview Terrace
- 887 Via Ondulando
- 961 Colina Vista
- 978 Colina Vista
- 691 Via Ondulando
- 1161 Via Arroyo
- 683 Colina Vista
- 7017 Sonora Ct
- 801 High Point Dr
- 1251 Via Cielito
- 6153 Cobblestone Dr
- 6174 Cobblestone Dr
- 191 Harborview Ct
- 6005 Sutter St
- 159 Donner Ave
- 146 Donner Ave
- 5438 Rainier St