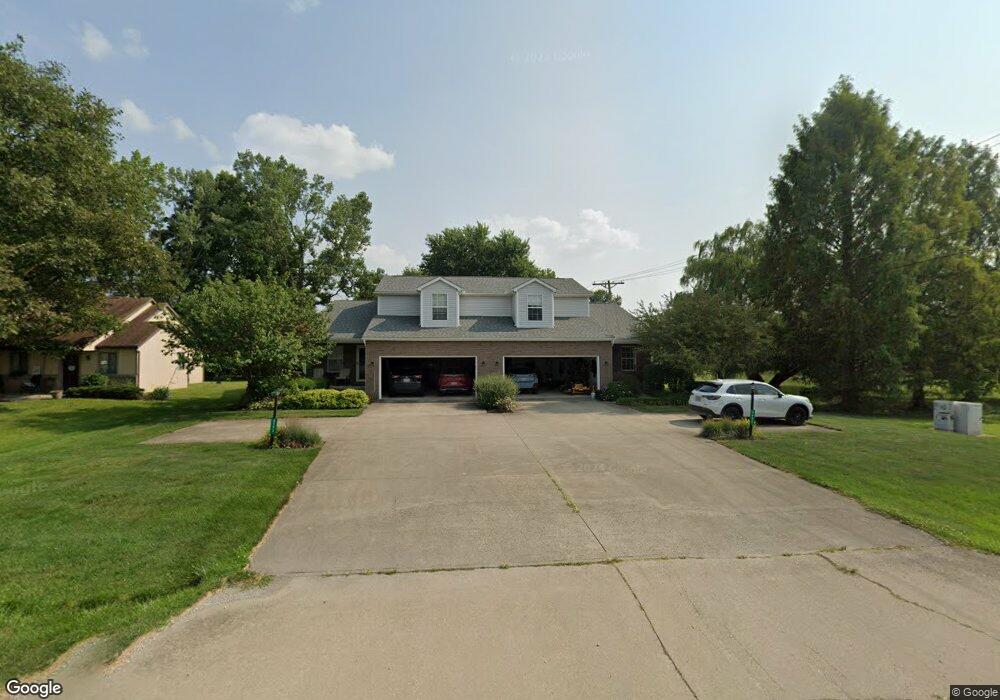
8993 Refugee Rd Pickerington, OH 43147
Estimated Value: $494,000 - $1,051,000
6
Beds
4
Baths
4,026
Sq Ft
$192/Sq Ft
Est. Value
About This Home
This home is located at 8993 Refugee Rd, Pickerington, OH 43147 and is currently estimated at $771,892, approximately $191 per square foot. 8993 Refugee Rd is a home located in Fairfield County with nearby schools including Violet Elementary School, Pickerington Lakeview Junior High School, and Toll Gate Middle School.
Ownership History
Date
Name
Owned For
Owner Type
Purchase Details
Closed on
May 14, 2018
Sold by
Parsley George F and Parsley Nancy B
Bought by
Parsley Kevin and Parsley Ryan
Current Estimated Value
Purchase Details
Closed on
Jul 9, 2012
Sold by
Parsley Kevin M
Bought by
Parsley George F and Parsley Nancy B
Home Financials for this Owner
Home Financials are based on the most recent Mortgage that was taken out on this home.
Original Mortgage
$140,000
Outstanding Balance
$60,026
Interest Rate
3.77%
Mortgage Type
Future Advance Clause Open End Mortgage
Estimated Equity
$711,866
Purchase Details
Closed on
Feb 27, 2002
Sold by
K Strait Inc
Bought by
Parsley Kevin M
Home Financials for this Owner
Home Financials are based on the most recent Mortgage that was taken out on this home.
Original Mortgage
$39,162
Interest Rate
6.92%
Mortgage Type
New Conventional
Purchase Details
Closed on
Sep 6, 1994
Sold by
Hiser Homes Inc
Bought by
K Strait Inc
Create a Home Valuation Report for This Property
The Home Valuation Report is an in-depth analysis detailing your home's value as well as a comparison with similar homes in the area
Home Values in the Area
Average Home Value in this Area
Purchase History
| Date | Buyer | Sale Price | Title Company |
|---|---|---|---|
| Parsley Kevin | -- | None Available | |
| Parsley George F | -- | Attorney | |
| Parsley Kevin M | $39,150 | -- | |
| K Strait Inc | $28,000 | -- |
Source: Public Records
Mortgage History
| Date | Status | Borrower | Loan Amount |
|---|---|---|---|
| Open | Parsley George F | $140,000 | |
| Closed | Parsley Kevin M | $39,162 |
Source: Public Records
Tax History Compared to Growth
Tax History
| Year | Tax Paid | Tax Assessment Tax Assessment Total Assessment is a certain percentage of the fair market value that is determined by local assessors to be the total taxable value of land and additions on the property. | Land | Improvement |
|---|---|---|---|---|
| 2024 | $17,694 | $149,320 | $20,090 | $129,230 |
| 2023 | $6,446 | $149,320 | $20,090 | $129,230 |
| 2022 | $6,884 | $149,320 | $20,090 | $129,230 |
| 2021 | $6,075 | $112,220 | $15,990 | $96,230 |
| 2020 | $6,141 | $112,220 | $15,990 | $96,230 |
| 2019 | $6,181 | $112,220 | $15,990 | $96,230 |
| 2018 | $3,274 | $98,290 | $14,760 | $83,530 |
| 2017 | $6,494 | $102,830 | $14,760 | $88,070 |
| 2016 | $6,459 | $102,830 | $14,760 | $88,070 |
| 2015 | $6,416 | $98,960 | $14,760 | $84,200 |
| 2014 | $6,335 | $98,960 | $14,760 | $84,200 |
| 2013 | $6,335 | $98,960 | $14,760 | $84,200 |
Source: Public Records
Map
Nearby Homes
- 1058 Milford Dr
- 1035 Milford Dr
- 12008 Sheldrake Ct
- 8950 Easton Dr
- 964 Dunmore Ct
- 812 Melrose Blvd
- 12316 Thoroughbred Dr
- 12335 Thoroughbred Dr
- 756 Stewart Ct
- 891 Dunvegan Cir
- 12394 Bentwood Farms Dr
- 11608 Meadow Ave
- 825 Brookside Dr
- Magnolia Plan at Graystone - Designer Collection
- Grandin Plan at Graystone - Designer Collection
- Calvin Plan at Graystone - Designer Collection
- Wyatt Plan at Graystone - Designer Collection
- Blair Plan at Graystone - Designer Collection
- Charles Plan at Graystone - Designer Collection
- Avery Plan at Graystone - Designer Collection
- 8985 Refugee Rd
- 8961 Refugee Rd
- 8859 Education Dr
- 1054 Milford Dr
- 12023 Auburn Ct
- 1056 Milford Dr
- 1052 Milford Dr
- 8945 Refugee Rd
- 1050 Milford Dr
- 12049 Auburn Ct
- 1048 Milford Dr
- 1053 Milford Dr
- 8879 Education Dr
- 8865 Education Dr
- 12022 Auburn Ct
- 1057 Milford Dr
- 1060 Milford Dr
- 1051 Milford Dr
- 12067 Auburn Ct
- 1046 Milford Dr