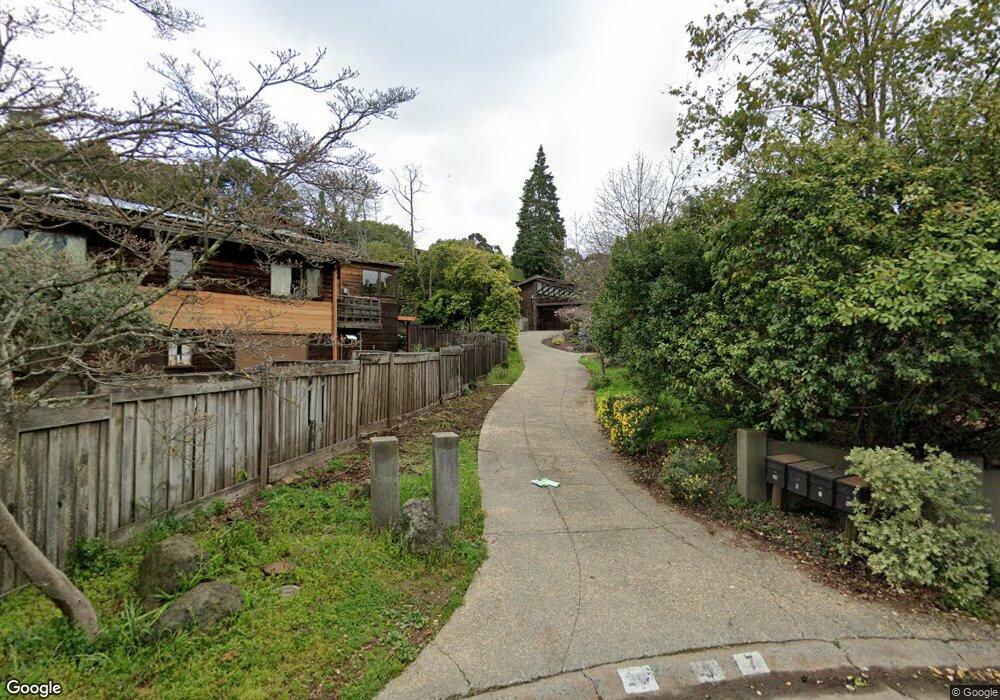
9 Ajax Place Berkeley, CA 94708
Berkeley Hills NeighborhoodEstimated Value: $1,855,000 - $2,249,459
4
Beds
3
Baths
2,550
Sq Ft
$796/Sq Ft
Est. Value
About This Home
This home is located at 9 Ajax Place, Berkeley, CA 94708 and is currently estimated at $2,030,615, approximately $796 per square foot. 9 Ajax Place is a home located in Alameda County with nearby schools including Cragmont Elementary School, Berkeley Arts Magnet at Whittier School, and Washington Elementary School.
Ownership History
Date
Name
Owned For
Owner Type
Purchase Details
Closed on
Mar 30, 2004
Sold by
Shank Charles V
Bought by
Reece Jane B and Ossa Paul P
Current Estimated Value
Home Financials for this Owner
Home Financials are based on the most recent Mortgage that was taken out on this home.
Original Mortgage
$1,000,000
Outstanding Balance
$427,929
Interest Rate
4.37%
Mortgage Type
Purchase Money Mortgage
Estimated Equity
$1,602,686
Purchase Details
Closed on
Sep 22, 1993
Sold by
Shank Brenda
Bought by
Shank Charles V
Home Financials for this Owner
Home Financials are based on the most recent Mortgage that was taken out on this home.
Original Mortgage
$289,000
Interest Rate
7.13%
Create a Home Valuation Report for This Property
The Home Valuation Report is an in-depth analysis detailing your home's value as well as a comparison with similar homes in the area
Home Values in the Area
Average Home Value in this Area
Purchase History
| Date | Buyer | Sale Price | Title Company |
|---|---|---|---|
| Reece Jane B | $1,520,000 | Old Republic Title Company | |
| Shank Charles V | -- | Fidelity National Title Insu |
Source: Public Records
Mortgage History
| Date | Status | Borrower | Loan Amount |
|---|---|---|---|
| Open | Reece Jane B | $1,000,000 | |
| Previous Owner | Shank Charles V | $289,000 |
Source: Public Records
Tax History
| Year | Tax Paid | Tax Assessment Tax Assessment Total Assessment is a certain percentage of the fair market value that is determined by local assessors to be the total taxable value of land and additions on the property. | Land | Improvement |
|---|---|---|---|---|
| 2025 | $29,859 | $2,164,822 | $648,299 | $1,523,523 |
| 2024 | $29,859 | $2,122,248 | $635,591 | $1,493,657 |
| 2023 | $29,274 | $2,087,498 | $623,128 | $1,464,370 |
| 2022 | $28,828 | $2,039,574 | $610,912 | $1,435,662 |
| 2021 | $29,342 | $1,999,458 | $598,937 | $1,407,521 |
| 2020 | $26,935 | $1,976,000 | $592,800 | $1,383,200 |
| 2019 | $26,126 | $1,937,254 | $581,176 | $1,356,078 |
| 2018 | $25,746 | $1,899,270 | $569,781 | $1,329,489 |
| 2017 | $24,891 | $1,862,030 | $558,609 | $1,303,421 |
| 2016 | $24,272 | $1,825,520 | $547,656 | $1,277,864 |
| 2015 | $22,165 | $1,650,000 | $495,000 | $1,155,000 |
| 2014 | $20,552 | $1,500,000 | $450,000 | $1,050,000 |
Source: Public Records
Map
Nearby Homes
- 1221 Grizzly Peak Blvd
- 1375 Queens Rd
- 1160 Miller Ave
- 230 Fairlawn Dr
- 1155 Keeler Ave
- 1110 Sterling Ave
- 1165 Cragmont Ave
- 1085 Creston Rd
- 2686 Shasta Rd
- 1024 Grizzly Peak Blvd
- 1106 Cragmont Ave
- 2501 Rose Walk
- 962 Regal Rd
- 935 Grizzly Peak Blvd
- 1698 La Loma Ave Unit 1698
- 2600 Hilgard Ave
- 2315 Eunice St
- 730 Wildcat Canyon Rd
- 2634 Virginia St Unit 33
- 2700 Le Conte Ave Unit 301
Your Personal Tour Guide
Ask me questions while you tour the home.