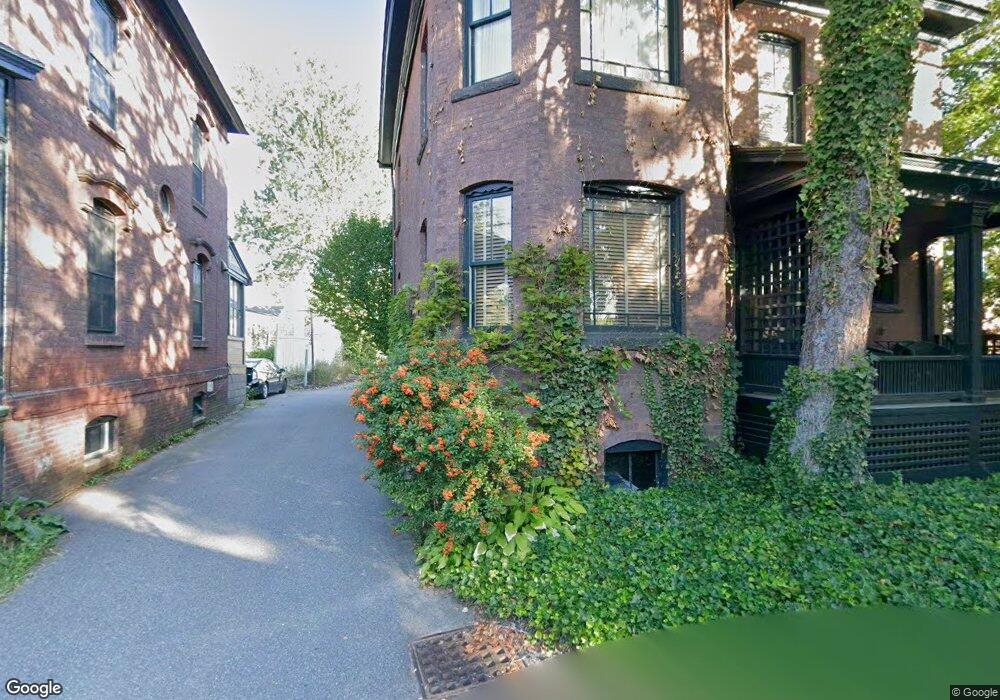
9 Allen Place Northampton, MA 01060
Estimated Value: $702,000 - $869,000
4
Beds
3
Baths
2,044
Sq Ft
$368/Sq Ft
Est. Value
About This Home
This home is located at 9 Allen Place, Northampton, MA 01060 and is currently estimated at $751,282, approximately $367 per square foot. 9 Allen Place is a home located in Hampshire County with nearby schools including Northampton High School, Hilltown Cooperative Charter Public School, and The Montessori School of Northampton.
Ownership History
Date
Name
Owned For
Owner Type
Purchase Details
Closed on
Dec 6, 2021
Sold by
Dyer Jane R and Dyer Thomas S
Bought by
Jr T
Current Estimated Value
Purchase Details
Closed on
Jan 15, 2003
Sold by
Reynolds John L and Reynolds Marilyn H
Bought by
Dyer Jane R and Dyer Thomas S
Create a Home Valuation Report for This Property
The Home Valuation Report is an in-depth analysis detailing your home's value as well as a comparison with similar homes in the area
Home Values in the Area
Average Home Value in this Area
Purchase History
| Date | Buyer | Sale Price | Title Company |
|---|---|---|---|
| Jr T | -- | None Available | |
| Dyer Jane R | $185,000 | -- |
Source: Public Records
Mortgage History
| Date | Status | Borrower | Loan Amount |
|---|---|---|---|
| Previous Owner | Dyer Jane R | $308,000 | |
| Previous Owner | Dyer Jane R | $286,000 | |
| Previous Owner | Dyer Jane R | $100,000 | |
| Previous Owner | Dyer Jane R | $175,000 |
Source: Public Records
Tax History Compared to Growth
Tax History
| Year | Tax Paid | Tax Assessment Tax Assessment Total Assessment is a certain percentage of the fair market value that is determined by local assessors to be the total taxable value of land and additions on the property. | Land | Improvement |
|---|---|---|---|---|
| 2025 | $10,552 | $757,500 | $229,200 | $528,300 |
| 2024 | $9,825 | $646,800 | $208,500 | $438,300 |
| 2023 | $9,423 | $594,900 | $189,500 | $405,400 |
| 2022 | $9,861 | $551,200 | $177,100 | $374,100 |
| 2021 | $8,445 | $486,200 | $164,300 | $321,900 |
| 2020 | $7,876 | $468,800 | $164,300 | $304,500 |
| 2019 | $7,844 | $451,600 | $164,300 | $287,300 |
| 2018 | $7,658 | $444,900 | $164,300 | $280,600 |
| 2017 | $7,425 | $444,900 | $164,300 | $280,600 |
| 2016 | $7,190 | $444,900 | $164,300 | $280,600 |
| 2015 | $6,938 | $439,100 | $147,500 | $291,600 |
| 2014 | $6,758 | $439,100 | $147,500 | $291,600 |
Source: Public Records
Map
Nearby Homes
- 43 Center St Unit K
- 30 Graves Ave Unit B
- 9 Walnut St Unit B
- 30 Cherry St
- 30 Cherry St Unit A
- 30 Cherry St Unit B
- 244 Main St
- 10 Hawley St Unit 4C
- 10 Hawley St Unit 4D
- 10 Hawley St Unit 4B
- 10 Hawley St Unit 4A
- 35 New South St Unit 307
- 215 State St
- 37 Finn St
- 67 Old South St
- 36 Butler Place
- 58 Phillips Place
- 5 Prospect Ct
- 12 School St
- 8 View Ave Unit A
- 11 Allen Place
- 10 Allen Place
- 61 Gothic St
- 12 Allen Place
- 88 King St
- 88 King St Unit B
- 65 Gothic St
- 57 Gothic St
- 53 Gothic St
- 71 Gothic St
- 6 Trumbull Rd
- 64 Gothic St Unit 103
- 64 Gothic St Unit 204
- 64 Gothic St Unit 203
- 64 Gothic St Unit 7
- 64 Gothic St Unit 201
- 64 Gothic St Unit 203 64
- 6 Trumbull Rd
- 10 Trumbull Rd
- 49 Gothic St