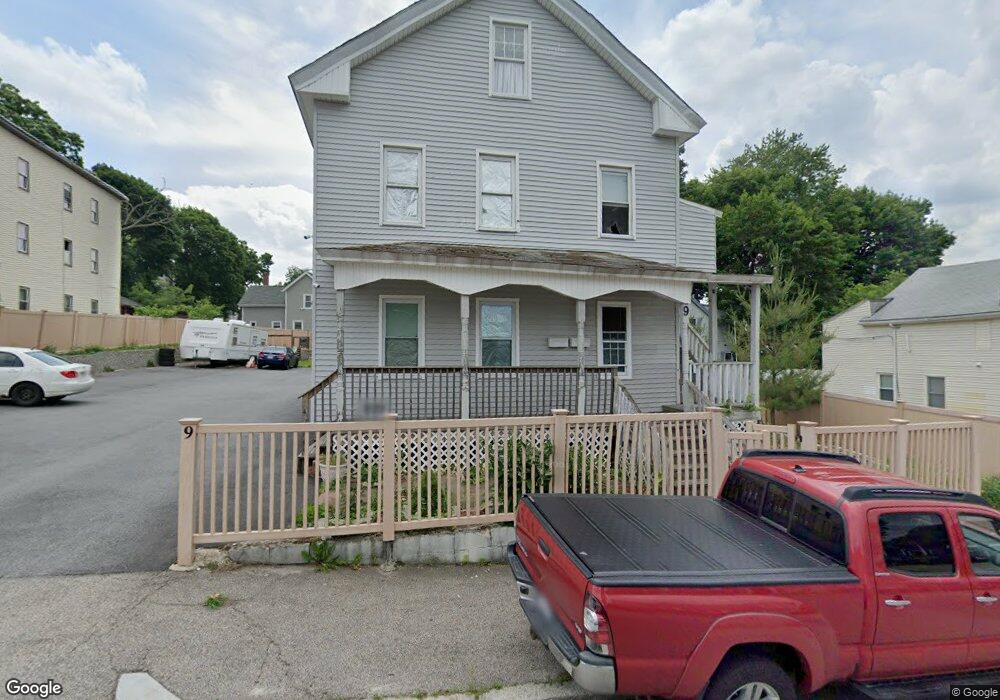
9 Bluff St Worcester, MA 01610
University Park NeighborhoodEstimated Value: $412,000 - $556,000
2
Beds
1
Bath
100
Sq Ft
$4,841/Sq Ft
Est. Value
About This Home
This home is located at 9 Bluff St, Worcester, MA 01610 and is currently estimated at $484,091, approximately $4,840 per square foot. 9 Bluff St is a home located in Worcester County with nearby schools including Jacob Hiatt Magnet School, Chandler Magnet, and Woodland Academy.
Ownership History
Date
Name
Owned For
Owner Type
Purchase Details
Closed on
Oct 3, 2002
Sold by
Rosado Ruben
Bought by
Santos Jose S and Santos Tania
Current Estimated Value
Home Financials for this Owner
Home Financials are based on the most recent Mortgage that was taken out on this home.
Original Mortgage
$208,550
Outstanding Balance
$88,135
Interest Rate
6.27%
Mortgage Type
Purchase Money Mortgage
Estimated Equity
$395,956
Purchase Details
Closed on
Dec 12, 1997
Sold by
Galarza William and Galarza Rita
Bought by
Rosado Ruben
Purchase Details
Closed on
Mar 29, 1994
Sold by
Fleet Bank Of Mass
Bought by
Galarza William and Galarza Rita
Purchase Details
Closed on
May 11, 1992
Sold by
Barngman Ashfeild
Bought by
Fleet Bank Of Mass
Create a Home Valuation Report for This Property
The Home Valuation Report is an in-depth analysis detailing your home's value as well as a comparison with similar homes in the area
Home Values in the Area
Average Home Value in this Area
Purchase History
| Date | Buyer | Sale Price | Title Company |
|---|---|---|---|
| Santos Jose S | $217,000 | -- | |
| Rosado Ruben | $64,000 | -- | |
| Galarza William | $7,500 | -- | |
| Fleet Bank Of Mass | $65,600 | -- |
Source: Public Records
Mortgage History
| Date | Status | Borrower | Loan Amount |
|---|---|---|---|
| Open | Fleet Bank Of Mass | $208,550 | |
| Previous Owner | Fleet Bank Of Mass | $17,300 |
Source: Public Records
Tax History
| Year | Tax Paid | Tax Assessment Tax Assessment Total Assessment is a certain percentage of the fair market value that is determined by local assessors to be the total taxable value of land and additions on the property. | Land | Improvement |
|---|---|---|---|---|
| 2025 | $4,627 | $350,800 | $77,300 | $273,500 |
| 2024 | $4,426 | $321,900 | $77,300 | $244,600 |
| 2023 | $4,061 | $283,200 | $62,100 | $221,100 |
| 2022 | $3,929 | $258,300 | $49,600 | $208,700 |
| 2021 | $3,445 | $211,600 | $39,700 | $171,900 |
| 2020 | $3,216 | $189,200 | $39,800 | $149,400 |
| 2019 | $3,391 | $188,400 | $39,400 | $149,000 |
| 2018 | $3,311 | $175,100 | $39,400 | $135,700 |
| 2017 | $2,954 | $153,700 | $39,400 | $114,300 |
| 2016 | $2,964 | $143,800 | $32,000 | $111,800 |
| 2015 | $2,886 | $143,800 | $32,000 | $111,800 |
| 2014 | $2,810 | $143,800 | $32,000 | $111,800 |
Source: Public Records
Map
Nearby Homes
- 7 Bluff St Unit 1
- 7 Bluff St Unit 3
- 13-1/2 Bluff St
- 13 1/2 Bluff St
- 13 Bluff St
- 13 Bluff St Unit 1
- 13 Bluff St Unit 2
- 5 Hollywood St
- 5 Bluff St
- 5 1/2 Bluff St
- 15 Bluff St
- 4 Hollywood St Unit 4-3
- 10 Bluff St
- 103 Bellevue St
- 8 Hollywood St
- 9 Hollywood St
- 8 Bluff St
- 3 1/2 Bluff Unit 3
- 3 1/2 Bluff Unit 1
- 17 Bluff St
Your Personal Tour Guide
Ask me questions while you tour the home.