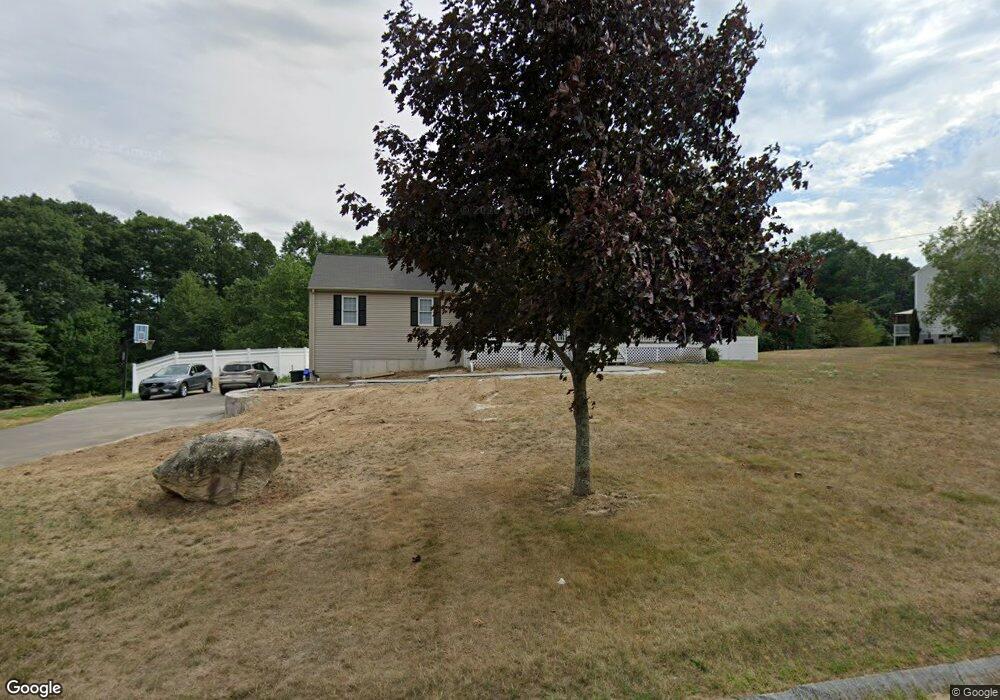
9 Casey Dr Milford, MA 01757
Estimated Value: $695,000 - $845,000
4
Beds
3
Baths
2,673
Sq Ft
$288/Sq Ft
Est. Value
About This Home
This home is located at 9 Casey Dr, Milford, MA 01757 and is currently estimated at $771,095, approximately $288 per square foot. 9 Casey Dr is a home located in Worcester County with nearby schools including Milford High School and Bethany Christian Academy.
Ownership History
Date
Name
Owned For
Owner Type
Purchase Details
Closed on
Jun 19, 2019
Sold by
Milford Federal Bank
Bought by
Keegan Christopher T and Keegan Diana M
Current Estimated Value
Home Financials for this Owner
Home Financials are based on the most recent Mortgage that was taken out on this home.
Original Mortgage
$324,000
Outstanding Balance
$284,298
Interest Rate
4%
Mortgage Type
New Conventional
Estimated Equity
$486,797
Purchase Details
Closed on
Nov 27, 2018
Sold by
Trafecante Christine B
Bought by
Milford Federal Bank
Purchase Details
Closed on
Oct 3, 2002
Sold by
F&D Central Rlty Co
Bought by
Trafecante Francis C and Trafecante Christine B
Home Financials for this Owner
Home Financials are based on the most recent Mortgage that was taken out on this home.
Original Mortgage
$273,522
Interest Rate
6.27%
Mortgage Type
Purchase Money Mortgage
Create a Home Valuation Report for This Property
The Home Valuation Report is an in-depth analysis detailing your home's value as well as a comparison with similar homes in the area
Home Values in the Area
Average Home Value in this Area
Purchase History
| Date | Buyer | Sale Price | Title Company |
|---|---|---|---|
| Keegan Christopher T | $405,000 | -- | |
| Milford Federal Bank | $362,650 | -- | |
| Trafecante Francis C | $418,578 | -- |
Source: Public Records
Mortgage History
| Date | Status | Borrower | Loan Amount |
|---|---|---|---|
| Open | Keegan Christopher T | $324,000 | |
| Previous Owner | Trafecante Francis C | $274,300 | |
| Previous Owner | Trafecante Francis C | $273,522 |
Source: Public Records
Tax History Compared to Growth
Tax History
| Year | Tax Paid | Tax Assessment Tax Assessment Total Assessment is a certain percentage of the fair market value that is determined by local assessors to be the total taxable value of land and additions on the property. | Land | Improvement |
|---|---|---|---|---|
| 2025 | $9,432 | $736,900 | $227,000 | $509,900 |
| 2024 | $9,344 | $703,100 | $218,300 | $484,800 |
| 2023 | $8,621 | $596,600 | $181,200 | $415,400 |
| 2022 | $7,921 | $514,700 | $165,900 | $348,800 |
| 2021 | $7,459 | $466,800 | $165,900 | $300,900 |
| 2020 | $7,367 | $461,600 | $165,900 | $295,700 |
| 2019 | $7,107 | $429,700 | $165,900 | $263,800 |
| 2018 | $7,152 | $431,900 | $168,100 | $263,800 |
| 2017 | $6,902 | $411,100 | $168,100 | $243,000 |
| 2016 | $6,784 | $394,900 | $168,100 | $226,800 |
| 2015 | $6,780 | $386,300 | $168,100 | $218,200 |
Source: Public Records
Map
Nearby Homes
- 23 Christina Rd
- 97 E Street Extension
- 33 Brown Bear Ln Unit 33
- 3 S Central St
- 10 Black Bear Unit 10
- 3 Black Bear Cir Unit 3
- 7 Black Bear Unit 7
- 9 Black Bear Cir Unit 9
- 11 Black Bear Unit 11
- 43 Black Bear Cir Unit 43
- 9 Hillside Ave
- 7 Howard St
- 48 Black Bear Cir Unit 48
- 30 Whitney St
- 3 Pouliot St Unit 3
- 57 Beach St
- 211A S Main St
- 48 Claflin St
- 222 S Main St
- 29 Forest St