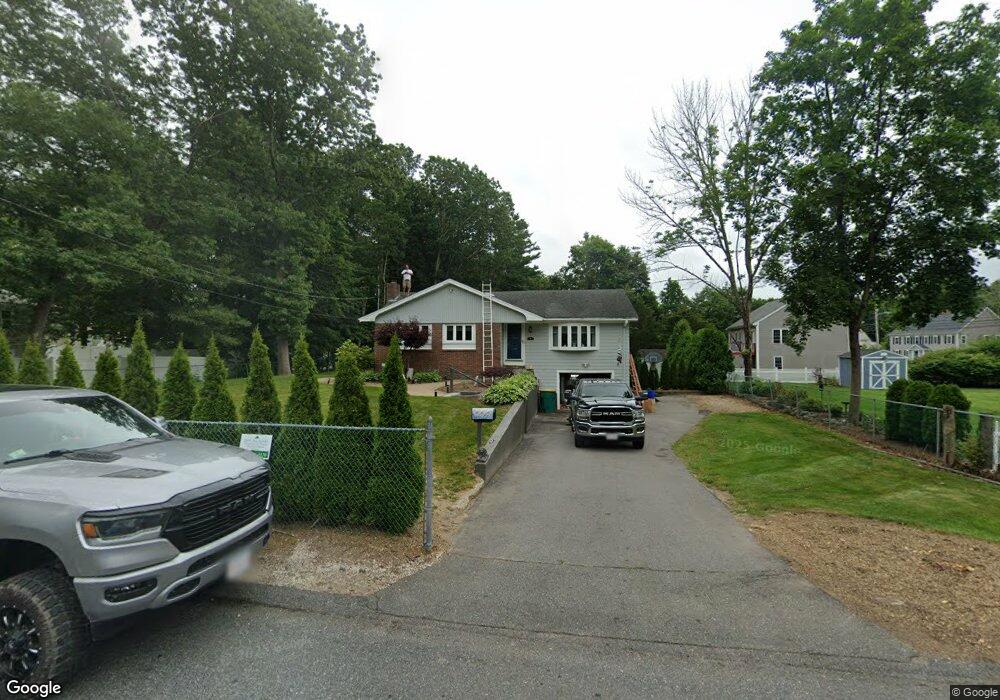
9 Chestnut St Mansfield, MA 02048
Estimated Value: $606,157 - $740,000
3
Beds
2
Baths
1,180
Sq Ft
$564/Sq Ft
Est. Value
About This Home
This home is located at 9 Chestnut St, Mansfield, MA 02048 and is currently estimated at $665,789, approximately $564 per square foot. 9 Chestnut St is a home located in Bristol County with nearby schools including Everett W. Robinson Elementary School, Jordan/Jackson Elementary School, and Harold L. Qualters Middle School.
Ownership History
Date
Name
Owned For
Owner Type
Purchase Details
Closed on
Jul 31, 2006
Sold by
Rivera Joaquin and Hill Patricia G
Bought by
Isaacson Adam and Isaacson Diane
Current Estimated Value
Create a Home Valuation Report for This Property
The Home Valuation Report is an in-depth analysis detailing your home's value as well as a comparison with similar homes in the area
Home Values in the Area
Average Home Value in this Area
Purchase History
| Date | Buyer | Sale Price | Title Company |
|---|---|---|---|
| Isaacson Adam | $305,000 | -- |
Source: Public Records
Tax History Compared to Growth
Tax History
| Year | Tax Paid | Tax Assessment Tax Assessment Total Assessment is a certain percentage of the fair market value that is determined by local assessors to be the total taxable value of land and additions on the property. | Land | Improvement |
|---|---|---|---|---|
| 2025 | $6,628 | $503,300 | $264,100 | $239,200 |
| 2024 | $6,322 | $468,300 | $275,600 | $192,700 |
| 2023 | $6,260 | $444,300 | $275,600 | $168,700 |
| 2022 | $6,086 | $401,200 | $255,200 | $146,000 |
| 2021 | $4,833 | $359,700 | $212,600 | $147,100 |
| 2020 | $5,459 | $355,400 | $212,600 | $142,800 |
| 2019 | $4,864 | $327,100 | $177,200 | $149,900 |
| 2018 | $4,635 | $301,700 | $168,900 | $132,800 |
| 2017 | $4,565 | $303,900 | $164,000 | $139,900 |
| 2016 | $4,497 | $291,800 | $156,200 | $135,600 |
| 2015 | $4,191 | $270,400 | $156,200 | $114,200 |
Source: Public Records
Map
Nearby Homes
- 414 Branch St
- 28 Court St
- 460 Ware St
- 442 Ware St
- 150 Rumford Ave Unit 110
- 22 Pleasant St Unit C
- 82 Brook St
- 166 Chauncy St
- 18 Columbine Rd
- 15 Reservoir St Unit 44
- 277 Central St
- 28 Angell St
- 44 Angell St Unit 44
- 631 East St Unit E203
- 619 N Main St
- 15 Rock Ln
- Lot 3 Birch Ln
- 212 Mill St
- 21 Juniper Rd
- 356 Central St