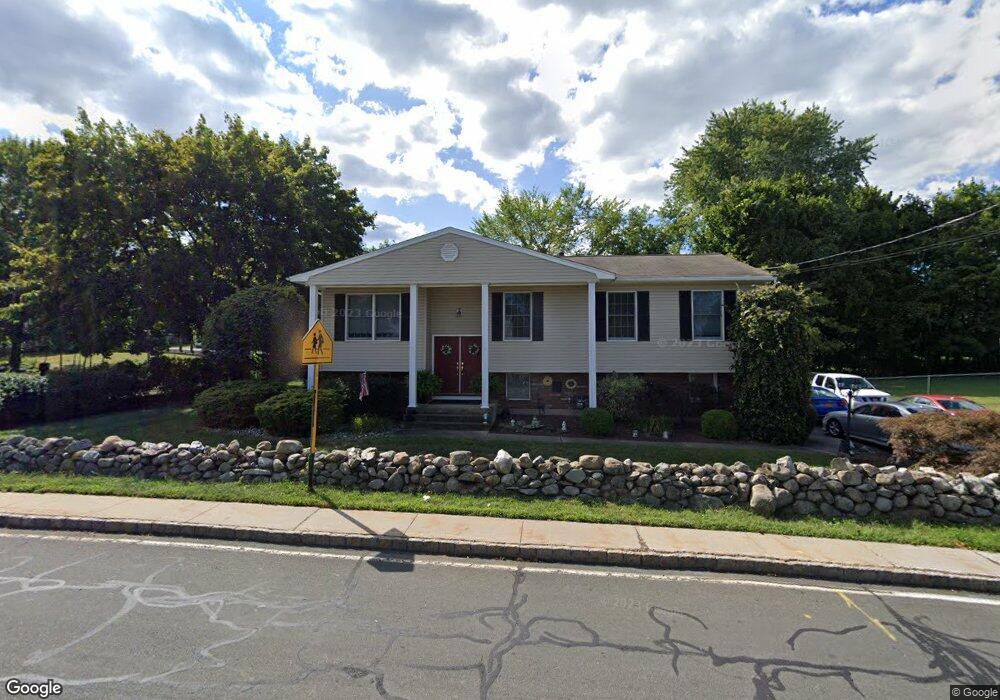
9 Cinder Rd Garnerville, NY 10923
Estimated Value: $669,000 - $724,000
4
Beds
3
Baths
1,332
Sq Ft
$520/Sq Ft
Est. Value
About This Home
This home is located at 9 Cinder Rd, Garnerville, NY 10923 and is currently estimated at $692,834, approximately $520 per square foot. 9 Cinder Rd is a home located in Rockland County with nearby schools including West Haverstraw Elementary School, Haverstraw Elementary School, and Fieldstone Secondary School.
Ownership History
Date
Name
Owned For
Owner Type
Purchase Details
Closed on
Aug 26, 2003
Sold by
Lopez James M and Lopez Marisa L
Bought by
Monte James F and Monte Denise
Current Estimated Value
Home Financials for this Owner
Home Financials are based on the most recent Mortgage that was taken out on this home.
Original Mortgage
$320,000
Outstanding Balance
$146,198
Interest Rate
6.02%
Mortgage Type
Purchase Money Mortgage
Estimated Equity
$546,636
Purchase Details
Closed on
Aug 27, 1998
Sold by
Lopez Josefina and Lopez James
Bought by
Lopez James M and Garguilo Marisa L
Home Financials for this Owner
Home Financials are based on the most recent Mortgage that was taken out on this home.
Original Mortgage
$125,000
Interest Rate
6.9%
Mortgage Type
Construction
Create a Home Valuation Report for This Property
The Home Valuation Report is an in-depth analysis detailing your home's value as well as a comparison with similar homes in the area
Home Values in the Area
Average Home Value in this Area
Purchase History
| Date | Buyer | Sale Price | Title Company |
|---|---|---|---|
| Monte James F | $420,000 | The Judicial Title Insurance | |
| Lopez James M | $157,000 | -- |
Source: Public Records
Mortgage History
| Date | Status | Borrower | Loan Amount |
|---|---|---|---|
| Open | Monte James F | $320,000 | |
| Previous Owner | Lopez James M | $125,000 |
Source: Public Records
Tax History
| Year | Tax Paid | Tax Assessment Tax Assessment Total Assessment is a certain percentage of the fair market value that is determined by local assessors to be the total taxable value of land and additions on the property. | Land | Improvement |
|---|---|---|---|---|
| 2024 | $22,722 | $297,100 | $121,600 | $175,500 |
| 2023 | $22,722 | $297,100 | $121,600 | $175,500 |
| 2022 | $4,748 | $297,100 | $121,600 | $175,500 |
| 2021 | $22,473 | $297,100 | $121,600 | $175,500 |
| 2020 | $13,075 | $297,100 | $121,600 | $175,500 |
| 2019 | $4,189 | $297,100 | $121,600 | $175,500 |
| 2018 | $12,727 | $297,100 | $121,600 | $175,500 |
| 2017 | $11,930 | $297,100 | $121,600 | $175,500 |
| 2016 | $11,910 | $297,100 | $121,600 | $175,500 |
| 2015 | -- | $297,100 | $121,600 | $175,500 |
| 2014 | -- | $297,100 | $121,600 | $175,500 |
Source: Public Records
Map
Nearby Homes
Your Personal Tour Guide
Ask me questions while you tour the home.