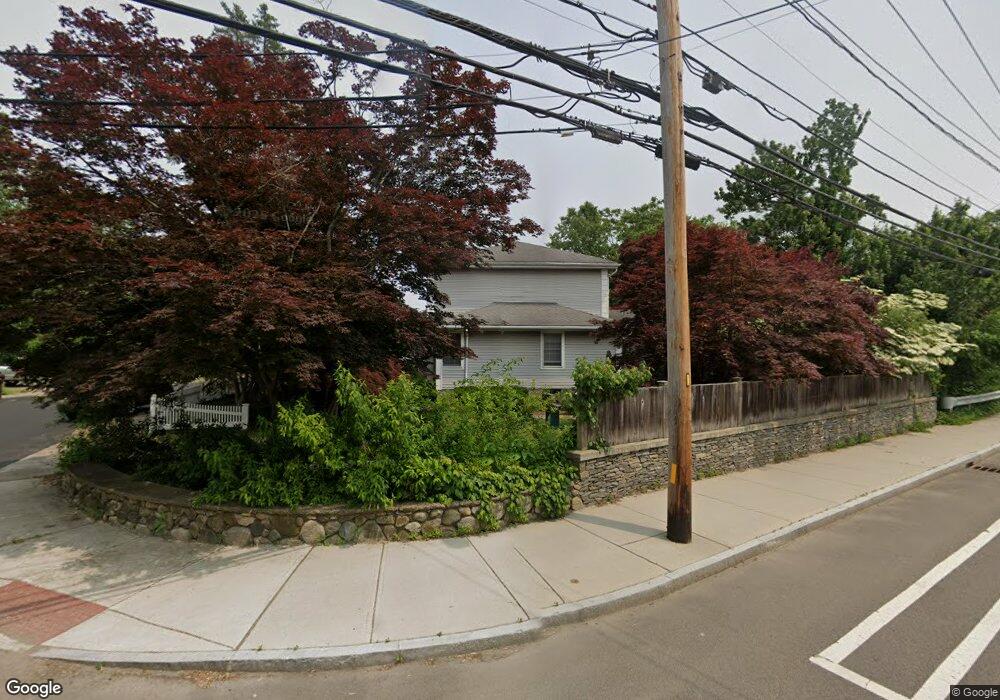
9 Clough Rd Unit 2 Dedham, MA 02026
Riverdale NeighborhoodEstimated Value: $936,000 - $1,163,000
1
Bed
1
Bath
450
Sq Ft
$2,309/Sq Ft
Est. Value
About This Home
This home is located at 9 Clough Rd Unit 2, Dedham, MA 02026 and is currently estimated at $1,039,192, approximately $2,309 per square foot. 9 Clough Rd Unit 2 is a home located in Norfolk County with nearby schools including Riverdale Elementary School, Dedham Middle School, and Dedham High School.
Ownership History
Date
Name
Owned For
Owner Type
Purchase Details
Closed on
May 1, 2018
Sold by
Carkin Robert B Est
Bought by
Anastasiadis Vasiliki
Current Estimated Value
Home Financials for this Owner
Home Financials are based on the most recent Mortgage that was taken out on this home.
Original Mortgage
$573,750
Outstanding Balance
$494,472
Interest Rate
4.44%
Mortgage Type
New Conventional
Estimated Equity
$544,720
Purchase Details
Closed on
May 5, 1976
Bought by
Carkin Robert B
Create a Home Valuation Report for This Property
The Home Valuation Report is an in-depth analysis detailing your home's value as well as a comparison with similar homes in the area
Home Values in the Area
Average Home Value in this Area
Purchase History
| Date | Buyer | Sale Price | Title Company |
|---|---|---|---|
| Anastasiadis Vasiliki | $675,000 | -- | |
| Carkin Robert B | -- | -- |
Source: Public Records
Mortgage History
| Date | Status | Borrower | Loan Amount |
|---|---|---|---|
| Open | Anastasiadis Vasiliki | $573,750 |
Source: Public Records
Tax History
| Year | Tax Paid | Tax Assessment Tax Assessment Total Assessment is a certain percentage of the fair market value that is determined by local assessors to be the total taxable value of land and additions on the property. | Land | Improvement |
|---|---|---|---|---|
| 2025 | $11,594 | $918,700 | $347,200 | $571,500 |
| 2024 | $10,816 | $865,300 | $314,800 | $550,500 |
| 2023 | $10,222 | $796,100 | $285,100 | $511,000 |
| 2022 | $9,910 | $742,300 | $267,800 | $474,500 |
| 2021 | $9,568 | $699,900 | $247,900 | $452,000 |
| 2020 | $9,066 | $660,800 | $247,900 | $412,900 |
| 2019 | $8,498 | $600,600 | $215,600 | $385,000 |
| 2018 | $8,342 | $573,300 | $188,300 | $385,000 |
| 2017 | $7,358 | $498,500 | $176,300 | $322,200 |
| 2016 | $7,519 | $485,400 | $163,200 | $322,200 |
| 2015 | $7,426 | $467,900 | $162,600 | $305,300 |
| 2014 | $7,048 | $438,300 | $159,700 | $278,600 |
Source: Public Records
Map
Nearby Homes
- 55 Maynard Rd
- 75 Bingham Ave
- 27 Pine St
- 570 Bridge St
- 92 Old River Place
- 47 Village Ave Unit 203
- 55 Church St Unit 1
- 147 Pine St
- 44 Court St
- 46 Church St
- 42 Churchill Place
- 441 Washington St Unit 301
- 441 Washington St Unit 302
- 8 Sumner St
- 442 High St
- 47 Bemis Rd
- 111 Schiller Rd
- 45 Commonwealth Ave
- 37 Horrigan Dr Unit 1
- 28 Linden Place
Your Personal Tour Guide
Ask me questions while you tour the home.