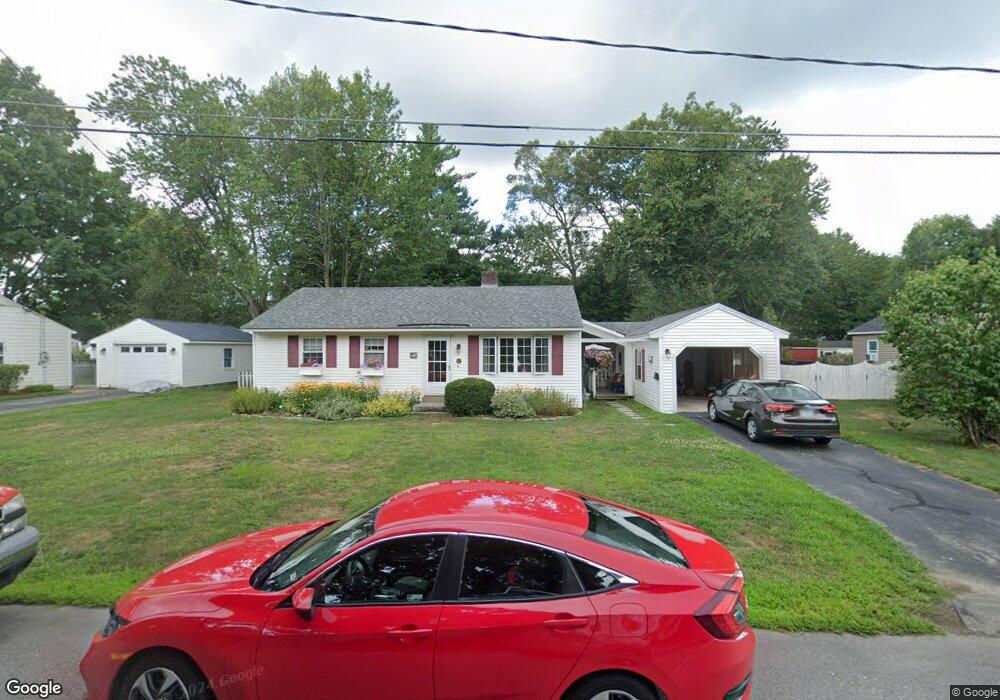
9 Conant Dr Concord, NH 03301
South End NeighborhoodEstimated Value: $417,000 - $448,000
3
Beds
1
Bath
1,090
Sq Ft
$395/Sq Ft
Est. Value
About This Home
This home is located at 9 Conant Dr, Concord, NH 03301 and is currently estimated at $431,089, approximately $395 per square foot. 9 Conant Dr is a home located in Merrimack County with nearby schools including Abbot-Downing School, Rundlett Middle School, and Concord High School.
Ownership History
Date
Name
Owned For
Owner Type
Purchase Details
Closed on
Aug 31, 2001
Sold by
Carlson Edwin I and Carlson Pearl M
Bought by
Carlson Lynn M
Current Estimated Value
Home Financials for this Owner
Home Financials are based on the most recent Mortgage that was taken out on this home.
Original Mortgage
$65,000
Interest Rate
7.06%
Mortgage Type
Purchase Money Mortgage
Create a Home Valuation Report for This Property
The Home Valuation Report is an in-depth analysis detailing your home's value as well as a comparison with similar homes in the area
Home Values in the Area
Average Home Value in this Area
Purchase History
| Date | Buyer | Sale Price | Title Company |
|---|---|---|---|
| Carlson Lynn M | $118,900 | -- |
Source: Public Records
Mortgage History
| Date | Status | Borrower | Loan Amount |
|---|---|---|---|
| Open | Carlson Lynn M | $80,000 | |
| Closed | Carlson Lynn M | $65,000 |
Source: Public Records
Tax History
| Year | Tax Paid | Tax Assessment Tax Assessment Total Assessment is a certain percentage of the fair market value that is determined by local assessors to be the total taxable value of land and additions on the property. | Land | Improvement |
|---|---|---|---|---|
| 2025 | $7,851 | $269,700 | $111,100 | $158,600 |
| 2024 | $7,468 | $269,700 | $111,100 | $158,600 |
| 2023 | $7,244 | $269,700 | $111,100 | $158,600 |
| 2022 | $6,983 | $269,700 | $111,100 | $158,600 |
| 2021 | $6,694 | $266,500 | $111,100 | $155,400 |
| 2020 | $6,222 | $232,500 | $88,800 | $143,700 |
| 2019 | $5,728 | $206,200 | $87,000 | $119,200 |
| 2018 | $5,720 | $202,900 | $87,000 | $115,900 |
| 2017 | $5,541 | $196,200 | $87,000 | $109,200 |
| 2016 | $5,232 | $189,100 | $85,400 | $103,700 |
| 2015 | $4,973 | $177,300 | $89,000 | $88,300 |
| 2014 | $4,753 | $177,300 | $89,000 | $88,300 |
| 2013 | -- | $174,900 | $89,000 | $85,900 |
| 2012 | -- | $169,100 | $89,000 | $80,100 |
Source: Public Records
Map
Nearby Homes
- 0 South St Unit 4969509
- 47 Noyes St
- 335 S Main St
- 40 Nivelle St
- 47 South St
- 289 South St
- 58 S State St
- 7-9 Myrtle St
- 25 N Spring St
- 30 Longmeadow Dr
- 22 Fairfield Dr
- 21 Fairfield Dr
- 20 Fairfield Dr
- 5 Holly Cir
- 5 Windchime Dr
- 19 Grappone Dr
- 30 Penacook St
- 28 Stevens Dr
- 4 Bow Center Rd Unit F2
- 26 Jonathan Ln
Your Personal Tour Guide
Ask me questions while you tour the home.