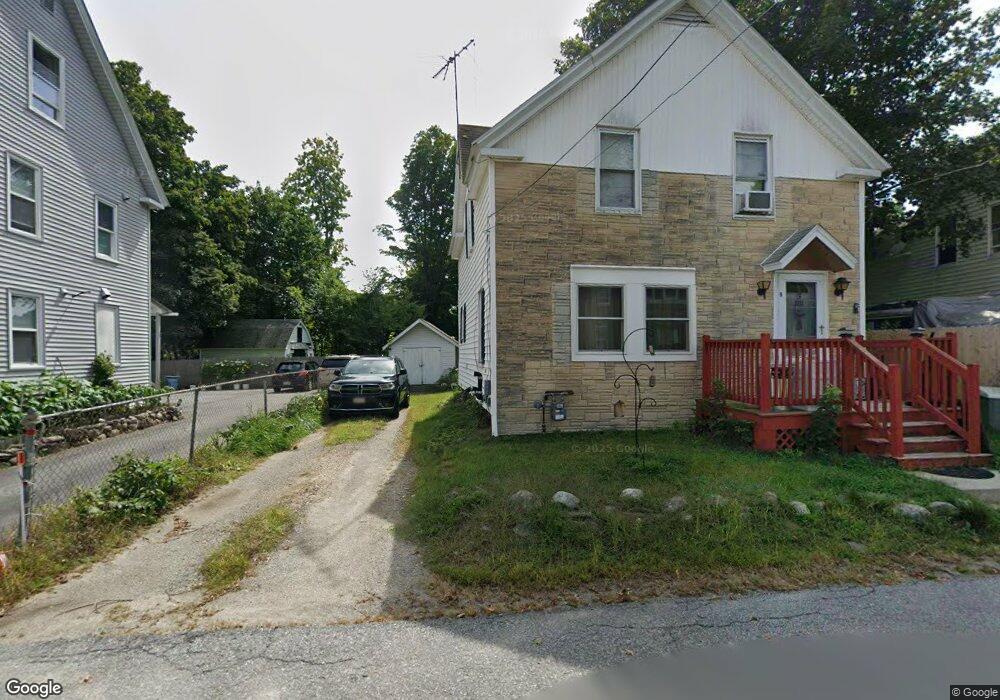
9 Crescent St Pepperell, MA 01463
Estimated Value: $318,000 - $499,000
3
Beds
1
Bath
1,001
Sq Ft
$382/Sq Ft
Est. Value
About This Home
This home is located at 9 Crescent St, Pepperell, MA 01463 and is currently estimated at $382,549, approximately $382 per square foot. 9 Crescent St is a home located in Middlesex County with nearby schools including North Middlesex Regional High School, Pepperell Christian Academy, and Maple Dene & Moppet School.
Ownership History
Date
Name
Owned For
Owner Type
Purchase Details
Closed on
Mar 1, 1988
Sold by
Lundeen Donald F
Bought by
Drinkwine Gary R
Current Estimated Value
Home Financials for this Owner
Home Financials are based on the most recent Mortgage that was taken out on this home.
Original Mortgage
$95,000
Interest Rate
10.49%
Mortgage Type
Purchase Money Mortgage
Create a Home Valuation Report for This Property
The Home Valuation Report is an in-depth analysis detailing your home's value as well as a comparison with similar homes in the area
Home Values in the Area
Average Home Value in this Area
Purchase History
| Date | Buyer | Sale Price | Title Company |
|---|---|---|---|
| Drinkwine Gary R | $87,600 | -- |
Source: Public Records
Mortgage History
| Date | Status | Borrower | Loan Amount |
|---|---|---|---|
| Closed | Drinkwine Gary R | $95,000 |
Source: Public Records
Tax History Compared to Growth
Tax History
| Year | Tax Paid | Tax Assessment Tax Assessment Total Assessment is a certain percentage of the fair market value that is determined by local assessors to be the total taxable value of land and additions on the property. | Land | Improvement |
|---|---|---|---|---|
| 2025 | $3,947 | $269,800 | $78,500 | $191,300 |
| 2024 | $3,765 | $262,400 | $71,100 | $191,300 |
| 2023 | $3,621 | $239,200 | $71,100 | $168,100 |
| 2022 | $3,473 | $202,500 | $63,600 | $138,900 |
| 2021 | $3,426 | $191,200 | $56,100 | $135,100 |
| 2020 | $3,264 | $192,200 | $56,100 | $136,100 |
| 2019 | $2,950 | $177,800 | $56,100 | $121,700 |
| 2018 | $2,699 | $164,700 | $56,100 | $108,600 |
| 2017 | $2,512 | $158,100 | $52,400 | $105,700 |
| 2016 | $2,496 | $151,000 | $52,400 | $98,600 |
| 2015 | $2,397 | $150,300 | $52,400 | $97,900 |
| 2014 | $2,292 | $144,500 | $52,400 | $92,100 |
Source: Public Records
Map
Nearby Homes
- 10 Tucker St
- 35 Hollis St Unit 1
- 4 Parker Hill Way Unit C
- 38 River Rd Unit 11
- 31 Prospect St
- 28-30 Groton St
- 9 Tarbell St
- 38 Tarbell St Unit 5B
- 55 Park St
- 31 Heald St
- 6 Mason St Unit 31
- 7 Maureens Way
- 7 Birch Hill Rd
- 5 June St
- 208 North St
- 142 River Rd
- 18 Maple St Unit 14
- 18 Maple St Unit 30
- 120 Townsend St Unit 1
- 10 Boynton St
- 7 Crescent St
- 11 Crescent St
- 5 Crescent St
- 14 Crescent St Unit 16
- 3 Crescent St
- 8 Crescent St
- 18 Crescent St Unit 20
- 10 Cross St
- 46 Crescent St
- 10 Crescent St
- 6 Cross St
- 6-8 Cross St
- 9 Franklin St
- 12 Cross St Unit A
- 12 Cross St Unit B
- 14 Cross St
- 14 Cross St Unit 14
- 14 Cross St Unit 1
- 48 Main St
- 7 Franklin St