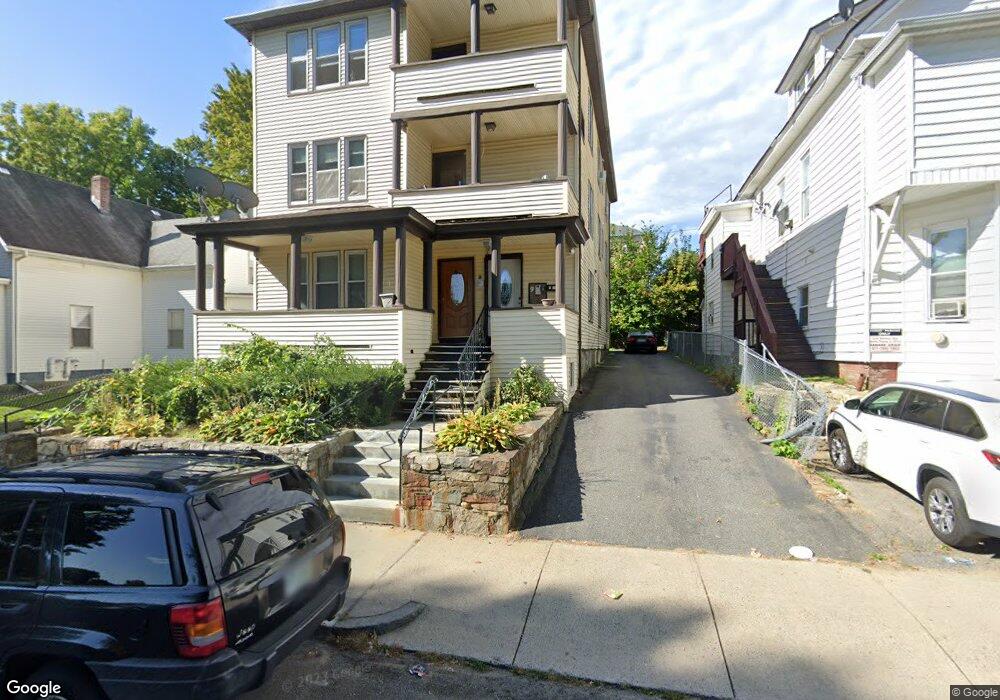
9 Crystal St Unit 2 Worcester, MA 01603
University Park NeighborhoodEstimated Value: $612,000 - $743,000
3
Beds
1
Bath
1,275
Sq Ft
$542/Sq Ft
Est. Value
About This Home
This home is located at 9 Crystal St Unit 2, Worcester, MA 01603 and is currently estimated at $691,667, approximately $542 per square foot. 9 Crystal St Unit 2 is a home located in Worcester County with nearby schools including Goddard School of Science & Technology, Jacob Hiatt Magnet School, and Chandler Magnet.
Ownership History
Date
Name
Owned For
Owner Type
Purchase Details
Closed on
Nov 10, 2017
Sold by
Maxmia Properties Llc
Bought by
Djafari North Llc
Current Estimated Value
Purchase Details
Closed on
Feb 4, 2011
Sold by
Djafri Nader
Bought by
Crystal Props Llc
Purchase Details
Closed on
Aug 7, 2009
Sold by
Kwarteng Margaret
Bought by
Djafari Nader
Purchase Details
Closed on
Jul 10, 2002
Sold by
Nguyen Viet V
Bought by
Kwarteng Margaret
Purchase Details
Closed on
Oct 1, 1998
Sold by
Beaucage Frances T
Bought by
Nguyen
Create a Home Valuation Report for This Property
The Home Valuation Report is an in-depth analysis detailing your home's value as well as a comparison with similar homes in the area
Home Values in the Area
Average Home Value in this Area
Purchase History
| Date | Buyer | Sale Price | Title Company |
|---|---|---|---|
| Djafari North Llc | -- | -- | |
| Crystal Props Llc | -- | -- | |
| Djafari Nader | $150,000 | -- | |
| Kwarteng Margaret | $259,900 | -- | |
| Nguyen | $115,000 | -- |
Source: Public Records
Mortgage History
| Date | Status | Borrower | Loan Amount |
|---|---|---|---|
| Previous Owner | Nguyen | $216,000 | |
| Previous Owner | Nguyen | $338,746 | |
| Previous Owner | Nguyen | $307,500 |
Source: Public Records
Tax History
| Year | Tax Paid | Tax Assessment Tax Assessment Total Assessment is a certain percentage of the fair market value that is determined by local assessors to be the total taxable value of land and additions on the property. | Land | Improvement |
|---|---|---|---|---|
| 2025 | $6,483 | $491,500 | $76,600 | $414,900 |
| 2024 | $5,984 | $435,200 | $76,600 | $358,600 |
| 2023 | $5,727 | $399,400 | $66,600 | $332,800 |
| 2022 | $4,981 | $327,500 | $53,300 | $274,200 |
| 2021 | $4,694 | $288,300 | $42,600 | $245,700 |
| 2020 | $4,338 | $255,200 | $42,300 | $212,900 |
| 2019 | $4,325 | $240,300 | $37,000 | $203,300 |
| 2018 | $4,224 | $223,400 | $37,000 | $186,400 |
| 2017 | $3,955 | $205,800 | $37,000 | $168,800 |
| 2016 | $3,786 | $183,700 | $26,900 | $156,800 |
| 2015 | $3,687 | $183,700 | $26,900 | $156,800 |
| 2014 | $3,589 | $183,700 | $26,900 | $156,800 |
Source: Public Records
Map
Nearby Homes
Your Personal Tour Guide
Ask me questions while you tour the home.