
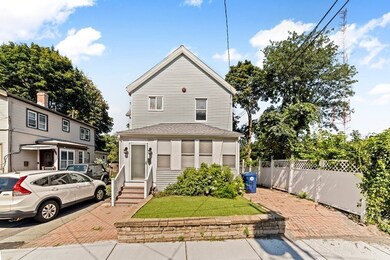
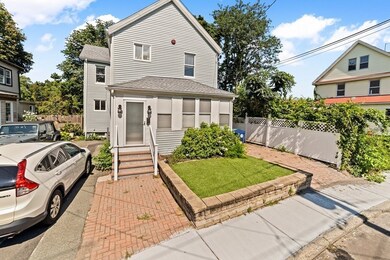
9 Curve St West Newton, MA 02465
Auburndale Neighborhood
3
Beds
3
Baths
2,610
Sq Ft
3,049
Sq Ft Lot
About This Home
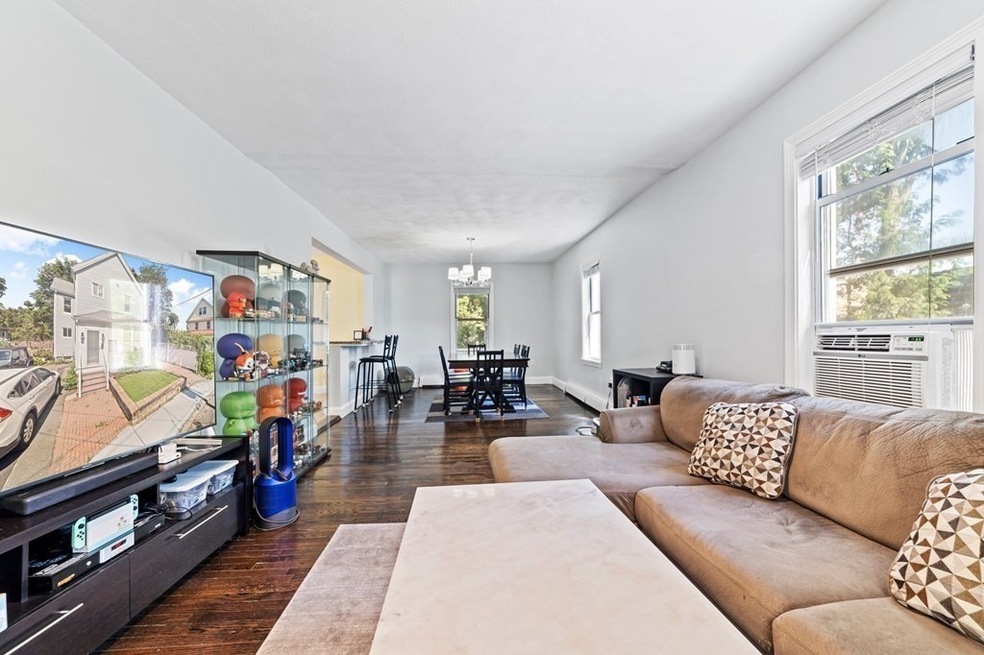
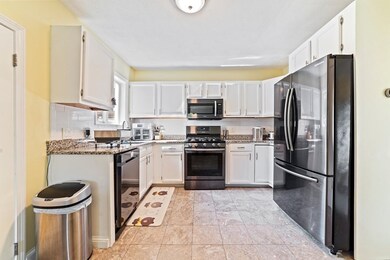
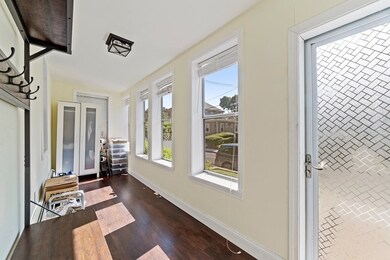
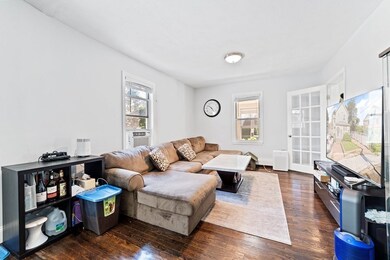
As of January 2022This West Newton single family home locates just 2 mins from the Mass Pike, easy access to I95, I93, Rt. 20/Rt.16, offers quick access to Boston commute within 15 mins and truly is a commuter's dream! Beautiful neighborhood conveniently close to restaurants/shopping/schools/hospital and many more. This updated single family home has 2 off street parking, hardwood flooring throughout, great open layout on the 1st floor w/ living and dining area, large modern renovated kitchen with additional breakfast bar/granite countertops/stainless steel appliances/tasteful backsplash, half bath & pantry area which gives access to the yard space. 2nd fl has 3 good size bedrooms & full bath. Lower level has finished basement, another full bath for additional living space. The home has many recent updates, oil to gas conversion w/ Navien tankless combo system, new roof w/ extended warranty/blown in insulation(2019), kitchen/bathroom renovations w/new appliances, & fully insulated attic for storage.
Last Agent to Sell the Property
Bonnie Lai
RE/MAX Real Estate Center Listed on: 09/15/2021
Home Details
Home Type
- Single Family
Est. Annual Taxes
- $8,362
Year Built
- 1920
Utilities
- 4 Cooling Zones
- 3 Heating Zones
Ownership History
Date
Name
Owned For
Owner Type
Purchase Details
Listed on
Sep 15, 2021
Closed on
Jan 31, 2022
Sold by
Tom Stanley and Fu Jessica
Bought by
Jiang Zhichang and Zhong Lihua
Seller's Agent
Bonnie Lai
RE/MAX Real Estate Center
Buyer's Agent
ken peng
Downtown Boston Real Estate, LLC
List Price
$839,000
Sold Price
$775,000
Premium/Discount to List
-$64,000
-7.63%
Current Estimated Value
Home Financials for this Owner
Home Financials are based on the most recent Mortgage that was taken out on this home.
Estimated Appreciation
$326,228
Avg. Annual Appreciation
10.62%
Original Mortgage
$465,000
Outstanding Balance
$438,474
Interest Rate
4.13%
Mortgage Type
Purchase Money Mortgage
Estimated Equity
$662,754
Purchase Details
Listed on
Jul 11, 2018
Closed on
Sep 28, 2018
Sold by
Green View Group Llc
Bought by
Stanley Fu Jessica and Stanley Tom
Seller's Agent
Marilyn Burke
Keller Williams Realty Boston South West
Buyer's Agent
Maggie Wong
Eastern Elite Realty, LLC
List Price
$825,000
Sold Price
$740,000
Premium/Discount to List
-$85,000
-10.3%
Home Financials for this Owner
Home Financials are based on the most recent Mortgage that was taken out on this home.
Avg. Annual Appreciation
1.39%
Original Mortgage
$592,000
Interest Rate
4.5%
Mortgage Type
New Conventional
Purchase Details
Listed on
Mar 8, 2017
Closed on
Dec 22, 2017
Sold by
Alam Mohammad and Alam Nargis
Bought by
Green View Group Llc
Seller's Agent
Radhy Pena
Pondside Realty
Buyer's Agent
Radhy Pena
Pondside Realty
List Price
$499,000
Sold Price
$325,000
Premium/Discount to List
-$174,000
-34.87%
Home Financials for this Owner
Home Financials are based on the most recent Mortgage that was taken out on this home.
Avg. Annual Appreciation
199.55%
Purchase Details
Closed on
Aug 31, 2000
Sold by
Asif Rt
Bought by
Saeed T
Home Financials for this Owner
Home Financials are based on the most recent Mortgage that was taken out on this home.
Original Mortgage
$202,500
Interest Rate
8.16%
Mortgage Type
Purchase Money Mortgage
Purchase Details
Closed on
Aug 28, 1989
Sold by
Osullivan Edward E
Bought by
Saeed Raja M
Home Financials for this Owner
Home Financials are based on the most recent Mortgage that was taken out on this home.
Original Mortgage
$140,000
Interest Rate
10.06%
Similar Homes in the area
Create a Home Valuation Report for This Property
The Home Valuation Report is an in-depth analysis detailing your home's value as well as a comparison with similar homes in the area
Home Values in the Area
Average Home Value in this Area
Purchase History
| Date | Type | Sale Price | Title Company |
|---|---|---|---|
| Not Resolvable | $775,000 | None Available | |
| Not Resolvable | $740,000 | -- | |
| Not Resolvable | $325,000 | -- | |
| Deed | $225,000 | -- | |
| Deed | $5,111 | -- |
Source: Public Records
Mortgage History
| Date | Status | Loan Amount | Loan Type |
|---|---|---|---|
| Open | $465,000 | Purchase Money Mortgage | |
| Previous Owner | $592,000 | New Conventional | |
| Previous Owner | $1,015,000 | Commercial | |
| Previous Owner | $1,015,000 | Commercial | |
| Previous Owner | $130,950 | No Value Available | |
| Previous Owner | $369,000 | No Value Available | |
| Previous Owner | $40,000 | No Value Available | |
| Previous Owner | $283,500 | No Value Available | |
| Previous Owner | $275,000 | No Value Available | |
| Previous Owner | $202,500 | Purchase Money Mortgage | |
| Previous Owner | $140,000 | No Value Available |
Source: Public Records
Property History
| Date | Event | Price | Change | Sq Ft Price |
|---|---|---|---|---|
| 01/31/2022 01/31/22 | Sold | $775,000 | -7.6% | $297 / Sq Ft |
| 12/06/2021 12/06/21 | Pending | -- | -- | -- |
| 09/15/2021 09/15/21 | For Sale | $839,000 | +13.4% | $321 / Sq Ft |
| 09/28/2018 09/28/18 | Sold | $740,000 | -6.3% | $277 / Sq Ft |
| 08/07/2018 08/07/18 | Pending | -- | -- | -- |
| 07/24/2018 07/24/18 | Price Changed | $790,000 | -4.2% | $296 / Sq Ft |
| 07/11/2018 07/11/18 | For Sale | $825,000 | +153.8% | $309 / Sq Ft |
| 12/29/2017 12/29/17 | Sold | $325,000 | -34.9% | $238 / Sq Ft |
| 03/13/2017 03/13/17 | Pending | -- | -- | -- |
| 03/08/2017 03/08/17 | For Sale | $499,000 | -- | $365 / Sq Ft |
Source: MLS Property Information Network (MLS PIN)
Tax History Compared to Growth
Tax History
| Year | Tax Paid | Tax Assessment Tax Assessment Total Assessment is a certain percentage of the fair market value that is determined by local assessors to be the total taxable value of land and additions on the property. | Land | Improvement |
|---|---|---|---|---|
| 2025 | $8,362 | $853,300 | $699,800 | $153,500 |
| 2024 | $8,085 | $828,400 | $679,400 | $149,000 |
| 2023 | $7,679 | $754,300 | $507,000 | $247,300 |
| 2022 | $7,347 | $698,400 | $469,400 | $229,000 |
| 2021 | $7,090 | $658,900 | $442,800 | $216,100 |
| 2020 | $6,879 | $658,900 | $442,800 | $216,100 |
| 2019 | $3,586 | $343,200 | $0 | $0 |
| 2018 | $4,515 | $417,300 | $325,700 | $91,600 |
| 2017 | $4,378 | $393,700 | $307,300 | $86,400 |
| 2016 | $4,187 | $367,900 | $287,200 | $80,700 |
| 2015 | $3,992 | $343,800 | $268,400 | $75,400 |
Source: Public Records
Agents Affiliated with this Home
-
B
Seller's Agent in 2022
Bonnie Lai
RE/MAX
-
ken peng
k
Buyer's Agent in 2022
ken peng
Downtown Boston Real Estate, LLC
(617) 680-7392
2 in this area
35 Total Sales
-
Marilyn Burke
Seller's Agent in 2018
Marilyn Burke
Keller Williams Realty Boston South West
(781) 603-5261
113 Total Sales
-
M
Buyer's Agent in 2018
Maggie Wong
Eastern Elite Realty, LLC
-
R
Seller's Agent in 2017
Radhy Pena
Pondside Realty
Map
Source: MLS Property Information Network (MLS PIN)
MLS Number: 72894912
APN: NEWT-000033-000006-000058
Disclaimer: Certain information contained herein is derived from information provided by parties other than Homes.com. All information provided is deemed reliable, but is not guaranteed to be accurate and should be independently verified.
![]() The property listing data and information, or the Images, set forth herein were provided to MLS Property Information Network, Inc. from third party sources, including sellers, lessors and public records, and were compiled by MLS Property Information Network, Inc. The property listing data and information, and the Images, are for the personal, non-commercial use of consumers having a good faith interest in purchasing or leasing listed properties of the type displayed to them and may not be used for any purpose other than to identify prospective properties which such consumers may have a good faith interest in purchasing or leasing. MLS Property Information Network, Inc. and its subscribers disclaim any and all representations and warranties as to the accuracy of the property listing data and information, or as to the accuracy of any of the Images, set forth herein.
The property listing data and information, or the Images, set forth herein were provided to MLS Property Information Network, Inc. from third party sources, including sellers, lessors and public records, and were compiled by MLS Property Information Network, Inc. The property listing data and information, and the Images, are for the personal, non-commercial use of consumers having a good faith interest in purchasing or leasing listed properties of the type displayed to them and may not be used for any purpose other than to identify prospective properties which such consumers may have a good faith interest in purchasing or leasing. MLS Property Information Network, Inc. and its subscribers disclaim any and all representations and warranties as to the accuracy of the property listing data and information, or as to the accuracy of any of the Images, set forth herein.
Nearby Homes
- 11 Prospect St Unit 11
- 0 Duncan Rd Unit 72925240
- 15 Simms Ct
- 17 Gilbert St
- 84 Auburn St Unit 1
- 94 Webster St Unit 96
- 46 Greenough St Unit 46
- 104 Oldham Rd
- 10 Fernwood Rd
- 228 Auburn St Unit 230
- 66 Webster St
- 29 Gambier St
- 194 Auburn St Unit 2
- 194 Auburn St
- 26 Sterling St
- 4 Rebecca Rd
- 1766 Commonwealth Ave Unit 1766
- 12 Inis Cir
- 160 Pine St Unit 10
- 30 Cheswick Rd