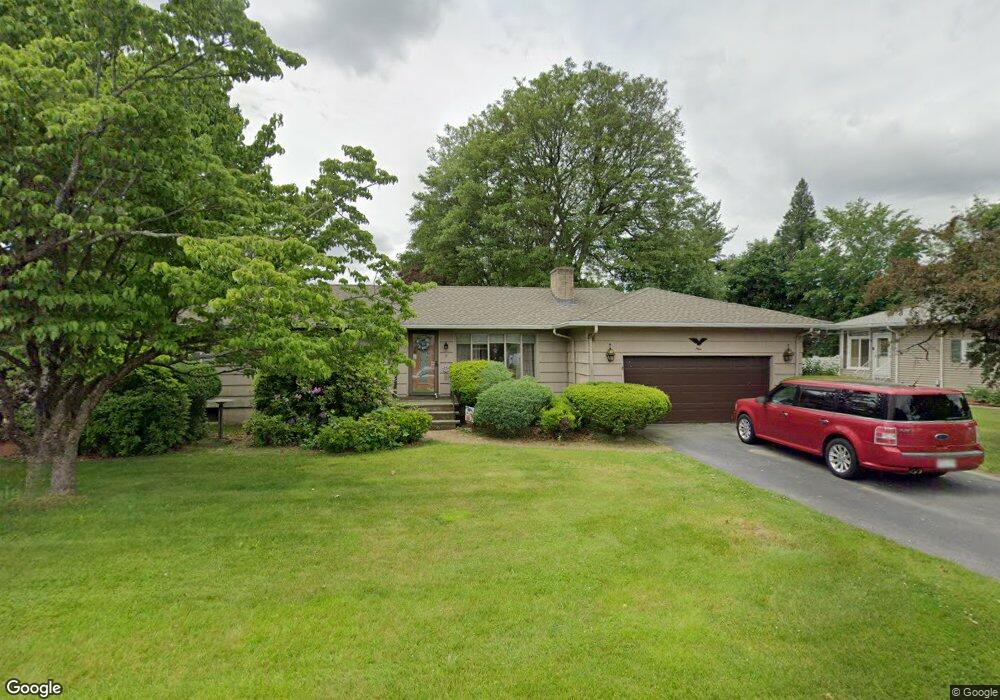
9 Dennis Dr Worcester, MA 01606
Greendale NeighborhoodEstimated Value: $430,000 - $457,000
3
Beds
2
Baths
1,276
Sq Ft
$350/Sq Ft
Est. Value
About This Home
This home is located at 9 Dennis Dr, Worcester, MA 01606 and is currently estimated at $446,855, approximately $350 per square foot. 9 Dennis Dr is a home located in Worcester County with nearby schools including Jacob Hiatt Magnet School, Chandler Magnet, and Thorndyke Road School.
Ownership History
Date
Name
Owned For
Owner Type
Purchase Details
Closed on
Dec 4, 2002
Sold by
Derderian Clifford M and Derderian Kathy A
Bought by
Cargill Laurence and Peltier Kathleen
Current Estimated Value
Home Financials for this Owner
Home Financials are based on the most recent Mortgage that was taken out on this home.
Original Mortgage
$138,000
Outstanding Balance
$59,704
Interest Rate
6.34%
Mortgage Type
Purchase Money Mortgage
Estimated Equity
$387,151
Create a Home Valuation Report for This Property
The Home Valuation Report is an in-depth analysis detailing your home's value as well as a comparison with similar homes in the area
Home Values in the Area
Average Home Value in this Area
Purchase History
| Date | Buyer | Sale Price | Title Company |
|---|---|---|---|
| Cargill Laurence | $235,000 | -- |
Source: Public Records
Mortgage History
| Date | Status | Borrower | Loan Amount |
|---|---|---|---|
| Open | Cargill Laurence | $138,000 | |
| Previous Owner | Cargill Laurence | $100,000 | |
| Previous Owner | Cargill Laurence | $55,000 |
Source: Public Records
Tax History
| Year | Tax Paid | Tax Assessment Tax Assessment Total Assessment is a certain percentage of the fair market value that is determined by local assessors to be the total taxable value of land and additions on the property. | Land | Improvement |
|---|---|---|---|---|
| 2025 | $5,300 | $401,800 | $118,800 | $283,000 |
| 2024 | $5,188 | $377,300 | $118,800 | $258,500 |
| 2023 | $5,224 | $364,300 | $103,300 | $261,000 |
| 2022 | $4,659 | $306,300 | $82,700 | $223,600 |
| 2021 | $4,707 | $289,100 | $66,100 | $223,000 |
| 2020 | $4,605 | $270,900 | $66,100 | $204,800 |
| 2019 | $4,342 | $241,200 | $59,600 | $181,600 |
| 2018 | $4,207 | $222,500 | $59,600 | $162,900 |
| 2017 | $4,276 | $222,500 | $59,600 | $162,900 |
| 2016 | $4,239 | $205,700 | $43,900 | $161,800 |
| 2015 | $4,128 | $205,700 | $43,900 | $161,800 |
| 2014 | $4,019 | $205,700 | $43,900 | $161,800 |
Source: Public Records
Map
Nearby Homes
- 15 Ericsson St
- 169 Whitmarsh Ave
- 39 Whitmarsh Ave
- 45 Goldthwaite Rd
- 323 Burncoat St
- 30 Melrose St
- 331 Burncoat St
- 44 Boardman St
- 58 Osceola Ave
- 3205 Halcyon Dr Unit 3205
- 66 Eunice Ave
- 31 Boardman St
- 2 Selden St
- 12 Erie Ave
- 33 Denmark St
- 30 Danielles Way
- 6 Roald St
- 27 Harlow St
- 25 Mckinley Rd
- 13 Fatima Ln
Your Personal Tour Guide
Ask me questions while you tour the home.