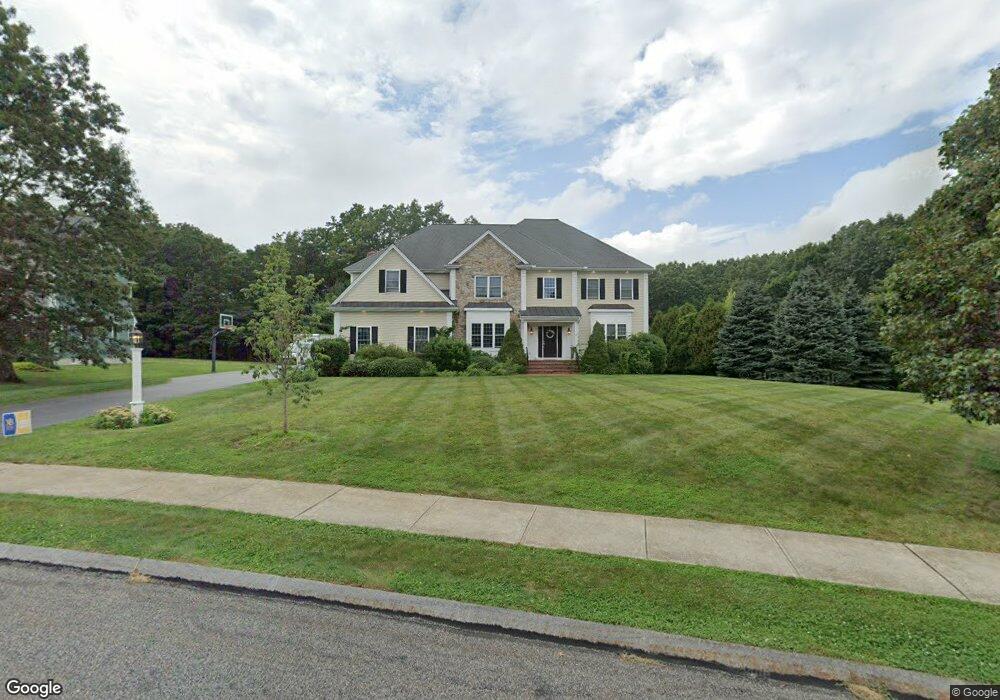
9 Dutchess Rd Franklin, MA 02038
Estimated Value: $1,236,358 - $1,626,000
5
Beds
4
Baths
5,530
Sq Ft
$264/Sq Ft
Est. Value
About This Home
This home is located at 9 Dutchess Rd, Franklin, MA 02038 and is currently estimated at $1,462,090, approximately $264 per square foot. 9 Dutchess Rd is a home located in Norfolk County with nearby schools including Gerald M. Parmenter Elementary School, Remington Middle School, and Franklin High School.
Ownership History
Date
Name
Owned For
Owner Type
Purchase Details
Closed on
Oct 2, 2023
Sold by
Kumari Shalini and Chadha Deepak
Bought by
Shalini Kumari Lt and Chadha
Current Estimated Value
Purchase Details
Closed on
Aug 24, 2011
Sold by
Leary Michael F and Leary Mary M
Bought by
Chadha Deepak and Kumari Shalini
Home Financials for this Owner
Home Financials are based on the most recent Mortgage that was taken out on this home.
Original Mortgage
$465,750
Interest Rate
3.68%
Mortgage Type
Purchase Money Mortgage
Purchase Details
Closed on
May 25, 2005
Sold by
Eastern Mgmt & Dev
Bought by
Leary Mary M and Leary Michael F
Home Financials for this Owner
Home Financials are based on the most recent Mortgage that was taken out on this home.
Original Mortgage
$807,000
Interest Rate
5.94%
Mortgage Type
Purchase Money Mortgage
Create a Home Valuation Report for This Property
The Home Valuation Report is an in-depth analysis detailing your home's value as well as a comparison with similar homes in the area
Purchase History
| Date | Buyer | Sale Price | Title Company |
|---|---|---|---|
| Shalini Kumari Lt | -- | None Available | |
| Chadha Deepak | $800,000 | -- | |
| Leary Mary M | $867,000 | -- |
Source: Public Records
Mortgage History
| Date | Status | Borrower | Loan Amount |
|---|---|---|---|
| Previous Owner | Chadha Deepak | $465,750 | |
| Previous Owner | Leary Mary M | $807,000 |
Source: Public Records
Tax History
| Year | Tax Paid | Tax Assessment Tax Assessment Total Assessment is a certain percentage of the fair market value that is determined by local assessors to be the total taxable value of land and additions on the property. | Land | Improvement |
|---|---|---|---|---|
| 2025 | $13,617 | $1,171,900 | $383,100 | $788,800 |
| 2024 | $12,861 | $1,090,800 | $383,100 | $707,700 |
| 2023 | $11,537 | $917,100 | $301,700 | $615,400 |
| 2022 | $11,300 | $804,300 | $262,400 | $541,900 |
| 2021 | $11,817 | $806,600 | $191,600 | $615,000 |
| 2020 | $11,342 | $781,700 | $197,300 | $584,400 |
| 2019 | $11,703 | $798,300 | $214,500 | $583,800 |
| 2018 | $10,604 | $723,800 | $201,100 | $522,700 |
| 2017 | $10,414 | $714,300 | $191,600 | $522,700 |
| 2016 | $11,696 | $806,600 | $295,500 | $511,100 |
| 2015 | $10,821 | $729,200 | $218,100 | $511,100 |
| 2014 | $10,774 | $745,600 | $234,500 | $511,100 |
Source: Public Records
Map
Nearby Homes
- 3 Oak View Terrace Unit 3
- 65 Jordan Rd
- 18 Northern Spy Rd
- 62 Uncas Ave Unit 1
- 60 Uncas Ave Unit 1
- 66 Uncas Ave Unit 1
- 68 Uncas Ave Unit 1
- 76 Uncas Ave Unit 1
- 9 Elliot Mills Unit 5
- 8 Elliot Mills Unit 30
- 5 Elliot Mills Unit 3
- 7 Elliot Mills Unit 4
- 10 Elliot Mills Unit 29
- 80 Uncas Ave Unit 1
- 82 Uncas Ave Unit 1
- 37 Cross St
- 14 Waites Crossing
- 10 Waites Crossing
- 5 Flintlocke Rd
- 90 E Central St Unit 304
- 5 Dutchess Rd
- 13 Dutchess Rd
- 10 Dutchess Rd
- 17 Dutchess Rd
- 14 Dutchess Rd
- 70 Jordan Rd
- 3 Oak View Terrace
- 4 Oak View Terrace
- 4 Oak View Terrace Unit 4,25
- 3 Oak View Terrace Unit 3-25
- 9 Birchtree Cir
- 8 Birchtree Cir
- 9 Birchtree Cir Unit 1
- 9 Birchtree Cir Unit 9
- 5 Oak View Terrace
- 76 Jordan Rd
- 6 Dutchess Rd
- 14 Crab Apple Ln
- 6,LOT Dutchess
- 18 Dutchess Rd
Your Personal Tour Guide
Ask me questions while you tour the home.