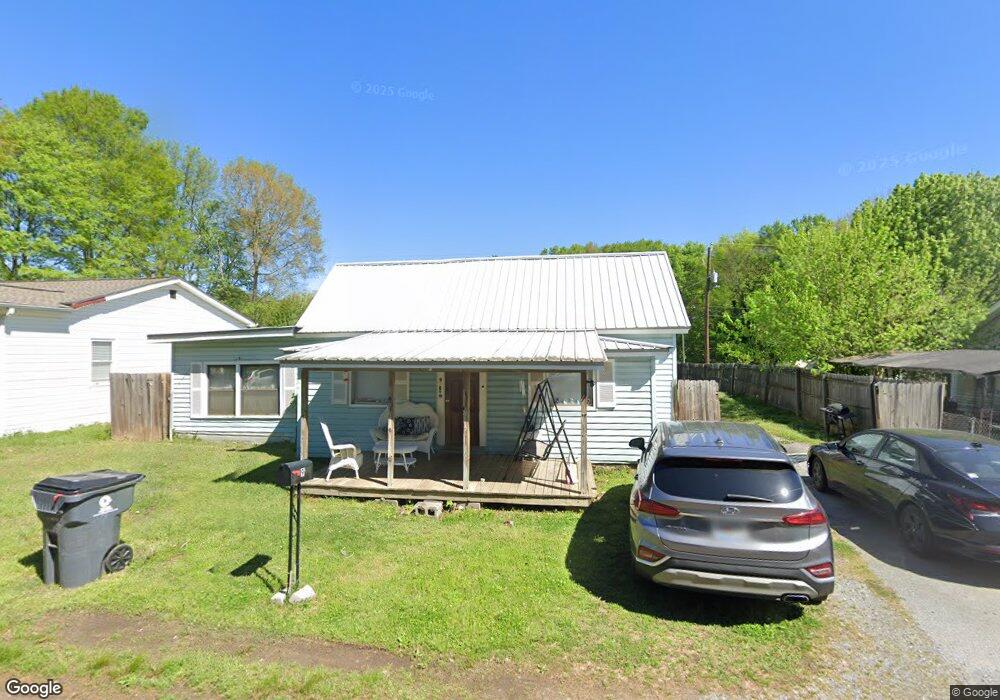
9 E 4th St Aragon, GA 30104
Estimated Value: $139,000 - $150,404
2
Beds
1
Bath
1,020
Sq Ft
$139/Sq Ft
Est. Value
About This Home
This home is located at 9 E 4th St, Aragon, GA 30104 and is currently estimated at $142,101, approximately $139 per square foot. 9 E 4th St is a home located in Polk County with nearby schools including Rockmart Middle School.
Ownership History
Date
Name
Owned For
Owner Type
Purchase Details
Closed on
Oct 28, 2020
Sold by
Lewis Bobby Joe
Bought by
Tanner Charles Jacob and Garrett Tabatha F
Current Estimated Value
Home Financials for this Owner
Home Financials are based on the most recent Mortgage that was taken out on this home.
Original Mortgage
$52,530
Outstanding Balance
$46,138
Interest Rate
2.8%
Mortgage Type
FHA
Estimated Equity
$95,963
Purchase Details
Closed on
Jan 29, 2018
Sold by
Waits James L
Bought by
Lewis Bobby Joe
Purchase Details
Closed on
Apr 3, 1989
Sold by
Statham Franklin
Bought by
Waits James L
Purchase Details
Closed on
Jul 3, 1980
Sold by
Wheeler James B and Wheeler J
Bought by
Statham Franklin
Purchase Details
Closed on
Jun 8, 1979
Sold by
Geneva G Jackson
Bought by
Wheeler James B and Wheeler J
Purchase Details
Closed on
Jun 30, 1970
Sold by
Duke Robert
Bought by
Mosley Geneva G Mrs
Purchase Details
Closed on
Dec 16, 1967
Sold by
Edwards M W
Bought by
Duke Robert
Purchase Details
Closed on
Oct 1, 1958
Bought by
Edwards M W
Create a Home Valuation Report for This Property
The Home Valuation Report is an in-depth analysis detailing your home's value as well as a comparison with similar homes in the area
Purchase History
| Date | Buyer | Sale Price | Title Company |
|---|---|---|---|
| Tanner Charles Jacob | $53,500 | -- | |
| Lewis Bobby Joe | -- | -- | |
| Waits James L | $18,900 | -- | |
| Statham Franklin | -- | -- | |
| Wheeler James B | $9,500 | -- | |
| Mosley Geneva G Mrs | -- | -- | |
| Duke Robert | -- | -- | |
| Edwards M W | -- | -- |
Source: Public Records
Mortgage History
| Date | Status | Borrower | Loan Amount |
|---|---|---|---|
| Open | Tanner Charles Jacob | $52,530 |
Source: Public Records
Tax History
| Year | Tax Paid | Tax Assessment Tax Assessment Total Assessment is a certain percentage of the fair market value that is determined by local assessors to be the total taxable value of land and additions on the property. | Land | Improvement |
|---|---|---|---|---|
| 2025 | $1,423 | $49,098 | $8,000 | $41,098 |
| 2024 | $1,414 | $49,310 | $8,000 | $41,310 |
| 2023 | $780 | $23,888 | $680 | $23,208 |
| 2022 | $496 | $20,896 | $680 | $20,216 |
| 2021 | $502 | $20,896 | $680 | $20,216 |
| 2020 | $459 | $19,054 | $680 | $18,374 |
| 2019 | $421 | $15,681 | $1,629 | $14,052 |
| 2018 | $368 | $15,337 | $1,629 | $13,708 |
| 2017 | $363 | $15,337 | $1,629 | $13,708 |
| 2016 | $363 | $15,337 | $1,629 | $13,708 |
| 2015 | $308 | $13,277 | $1,629 | $11,648 |
| 2014 | $301 | $12,940 | $1,292 | $11,648 |
Source: Public Records
Map
Nearby Homes
- 19 Walnut St
- 30 Oak St
- 28 Walnut St
- 34 Elm St
- 54 Taylorsville Rd
- 15 Aragon Rd
- 0 Rome Hwy 101 Unit 10445422
- 3 Magnolia St
- 5 Magnolia St
- 11 Magnolia St
- 65 Long Station Rd
- 1638 Prospect Rd
- 70 N Bellview Rd
- 2300 Frettiesburg Dr
- 156 Dogwood Glen Dr
- 38 Sarahs Hollow Dr
- 88 N Bellview Rd
- 94 Eastwood Path
- 62 Morgan Rd
- 133 N Bellview Rd
Your Personal Tour Guide
Ask me questions while you tour the home.