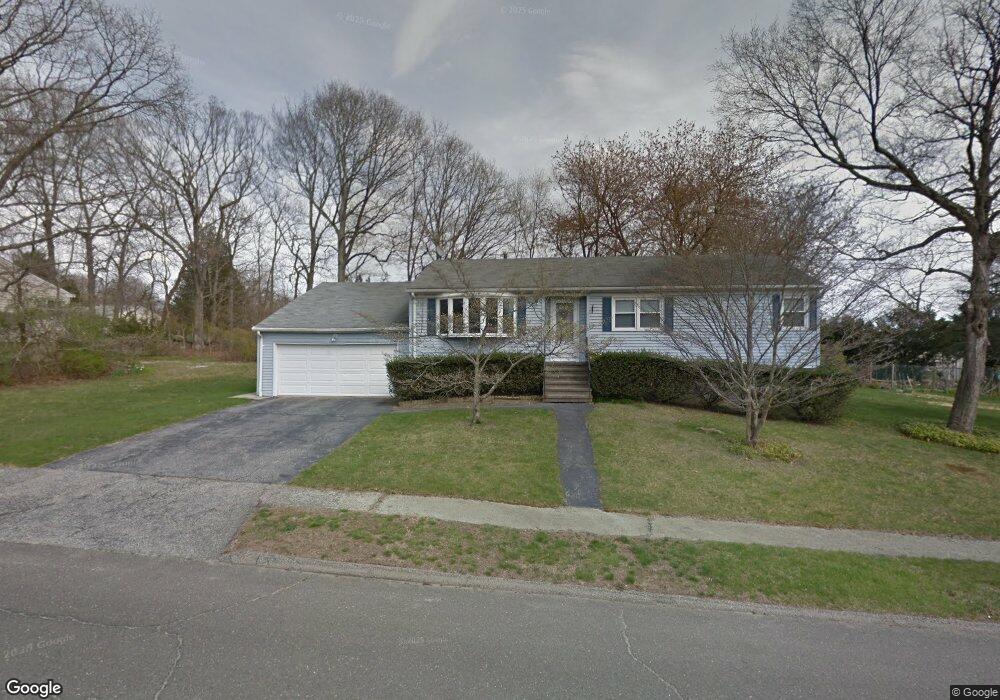
9 Fitzpatrick Rd Ansonia, CT 06401
Estimated Value: $507,249 - $562,000
4
Beds
3
Baths
1,918
Sq Ft
$276/Sq Ft
Est. Value
About This Home
This home is located at 9 Fitzpatrick Rd, Ansonia, CT 06401 and is currently estimated at $530,312, approximately $276 per square foot. 9 Fitzpatrick Rd is a home located in New Haven County with nearby schools including Ansonia Middle School, Ansonia High School, and St Mary & St Michael School.
Ownership History
Date
Name
Owned For
Owner Type
Purchase Details
Closed on
Jun 20, 2025
Sold by
Velardi David J
Bought by
Muzzi Megan
Current Estimated Value
Purchase Details
Closed on
Mar 29, 2016
Sold by
Muzzi Megan and Velardi David J
Bought by
Muzzi Megan
Home Financials for this Owner
Home Financials are based on the most recent Mortgage that was taken out on this home.
Original Mortgage
$180,000
Interest Rate
3.65%
Mortgage Type
New Conventional
Create a Home Valuation Report for This Property
The Home Valuation Report is an in-depth analysis detailing your home's value as well as a comparison with similar homes in the area
Home Values in the Area
Average Home Value in this Area
Purchase History
| Date | Buyer | Sale Price | Title Company |
|---|---|---|---|
| Muzzi Megan | -- | -- | |
| Muzzi Megan | -- | -- | |
| Muzzi Megan | -- | -- | |
| Velardi David J | $110,000 | -- | |
| Velardi David J | $110,000 | -- | |
| Velardi David J | $55,000 | -- | |
| Velardi David J | $55,000 | -- |
Source: Public Records
Mortgage History
| Date | Status | Borrower | Loan Amount |
|---|---|---|---|
| Previous Owner | Velardi David J | $180,000 |
Source: Public Records
Tax History
| Year | Tax Paid | Tax Assessment Tax Assessment Total Assessment is a certain percentage of the fair market value that is determined by local assessors to be the total taxable value of land and additions on the property. | Land | Improvement |
|---|---|---|---|---|
| 2025 | $8,058 | $282,240 | $52,640 | $229,600 |
| 2024 | $7,477 | $282,240 | $52,640 | $229,600 |
| 2023 | $7,406 | $282,240 | $52,640 | $229,600 |
| 2022 | $7,235 | $191,400 | $56,900 | $134,500 |
| 2021 | $7,235 | $191,400 | $56,900 | $134,500 |
| 2020 | $6,441 | $170,400 | $56,900 | $113,500 |
| 2019 | $6,441 | $170,400 | $56,900 | $113,500 |
| 2018 | $6,359 | $170,400 | $56,900 | $113,500 |
| 2017 | $5,143 | $137,800 | $54,200 | $83,600 |
| 2016 | $4,676 | $125,300 | $54,200 | $71,100 |
| 2015 | $4,679 | $124,700 | $54,200 | $70,500 |
| 2014 | $4,815 | $124,700 | $54,200 | $70,500 |
| 2013 | $4,906 | $124,700 | $54,200 | $70,500 |
Source: Public Records
Map
Nearby Homes
- 20 Fitzpatrick Rd
- 15 Derbyshire
- 26 Farrel Dr
- 40 Iannotti Ln
- 25 Beechwood Dr
- 94 Sunset Dr
- 6 Fairview St
- 84 Marshall Ln
- 22 Commodore Hull Dr
- 30 Commodore Hull Dr
- 55 David Humphrey Rd
- 91 Ford St
- 4 Beverly Dr
- 922 Baldwin Rd
- 32 Spring St
- 1 East Ct
- 5 Clifford Dr
- 2 Clifford Dr
- 73 Platt St
- 28 Mclaughlin Terrace
Your Personal Tour Guide
Ask me questions while you tour the home.