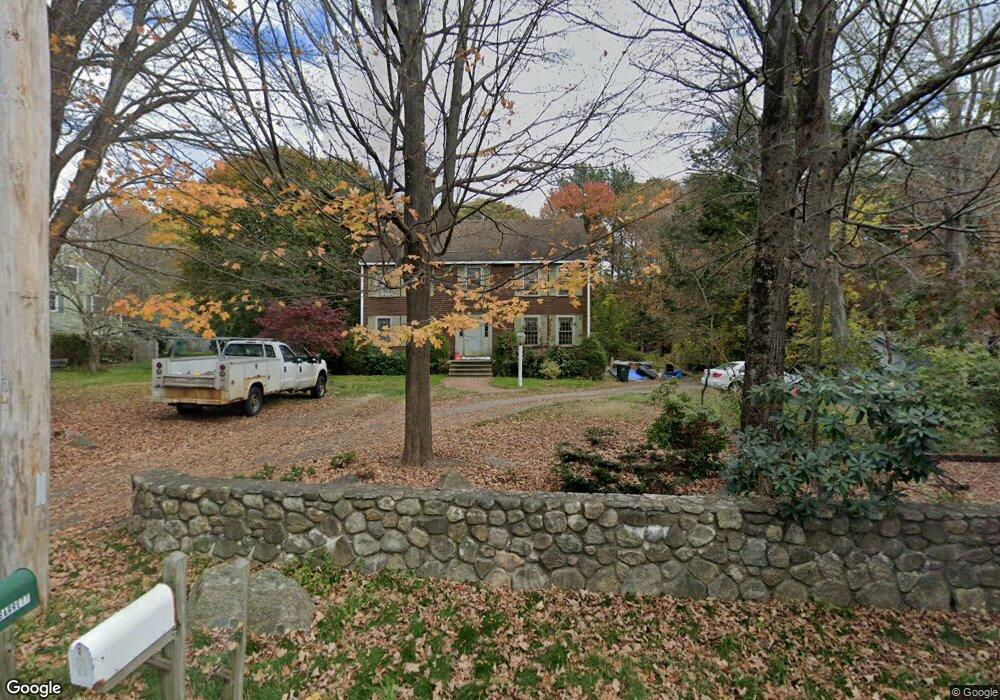
9 Forest St Franklin, MA 02038
Wadsworth NeighborhoodEstimated Value: $895,000 - $1,044,000
4
Beds
3
Baths
2,400
Sq Ft
$400/Sq Ft
Est. Value
About This Home
This home is located at 9 Forest St, Franklin, MA 02038 and is currently estimated at $959,331, approximately $399 per square foot. 9 Forest St is a home located in Norfolk County with nearby schools including Jefferson Elementary School, Remington Middle School, and Franklin High School.
Ownership History
Date
Name
Owned For
Owner Type
Purchase Details
Closed on
Dec 28, 2006
Sold by
Bassignani Michael S and Bassignani Karen A
Bought by
Bassignani Michael S
Current Estimated Value
Home Financials for this Owner
Home Financials are based on the most recent Mortgage that was taken out on this home.
Original Mortgage
$265,000
Outstanding Balance
$159,067
Interest Rate
6.29%
Mortgage Type
Purchase Money Mortgage
Estimated Equity
$800,264
Create a Home Valuation Report for This Property
The Home Valuation Report is an in-depth analysis detailing your home's value as well as a comparison with similar homes in the area
Home Values in the Area
Average Home Value in this Area
Purchase History
| Date | Buyer | Sale Price | Title Company |
|---|---|---|---|
| Bassignani Michael S | -- | -- |
Source: Public Records
Mortgage History
| Date | Status | Borrower | Loan Amount |
|---|---|---|---|
| Open | Bassignani Michael S | $265,000 |
Source: Public Records
Tax History Compared to Growth
Tax History
| Year | Tax Paid | Tax Assessment Tax Assessment Total Assessment is a certain percentage of the fair market value that is determined by local assessors to be the total taxable value of land and additions on the property. | Land | Improvement |
|---|---|---|---|---|
| 2025 | $9,837 | $846,600 | $244,600 | $602,000 |
| 2024 | $8,422 | $714,300 | $244,600 | $469,700 |
| 2023 | $8,474 | $673,600 | $246,600 | $427,000 |
| 2022 | $8,134 | $578,900 | $203,800 | $375,100 |
| 2021 | $7,584 | $517,700 | $218,400 | $299,300 |
| 2020 | $7,317 | $504,300 | $220,200 | $284,100 |
| 2019 | $7,091 | $483,700 | $199,500 | $284,200 |
| 2018 | $6,724 | $459,000 | $205,200 | $253,800 |
| 2017 | $6,444 | $442,000 | $188,200 | $253,800 |
| 2016 | $6,099 | $420,600 | $185,200 | $235,400 |
| 2015 | $6,173 | $416,000 | $180,600 | $235,400 |
| 2014 | $5,595 | $387,200 | $151,800 | $235,400 |
Source: Public Records
Map
Nearby Homes
- 732 King St
- 246 Washington St
- 0 Fall Ln
- 417 Union St
- 374-378 Union St
- 10 Stanford Rd
- 7 Howard Place
- 32 Dale St
- 1 Spring St
- 955 Summer St
- 99 Summer St
- 82 Uncas Ave Unit 1
- 70 Uncas Ave
- 64 Uncas Ave
- 215 Forest St
- 90 E Central St Unit 103
- 90 E Central St Unit 106
- 90 E Central St Unit 304
- 90 E Central St Unit 202
- 90 E Central St Unit 105