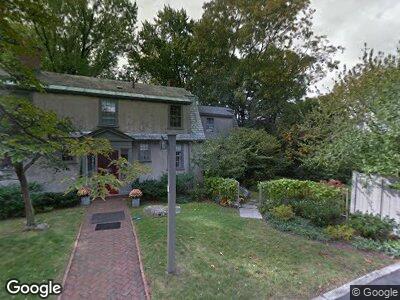
9 Foster Place Cambridge, MA 02138
West Cambridge NeighborhoodEstimated Value: $1,946,000 - $3,191,000
2
Beds
4
Baths
1,382
Sq Ft
$1,926/Sq Ft
Est. Value
About This Home
This home is located at 9 Foster Place, Cambridge, MA 02138 and is currently estimated at $2,661,555, approximately $1,925 per square foot. 9 Foster Place is a home located in Middlesex County with nearby schools including St Peter School, Shady Hill School, and Cambridge Montessori School.
Ownership History
Date
Name
Owned For
Owner Type
Purchase Details
Closed on
Apr 10, 2015
Sold by
Oconnor Rory A
Bought by
Oconnor Rory A and Oconnor H
Current Estimated Value
Purchase Details
Closed on
Feb 29, 2008
Sold by
Selig Mark Allan
Bought by
Oconnor Rory A
Purchase Details
Closed on
May 1, 1989
Sold by
Roukos Salim
Bought by
Selig Mark A
Home Financials for this Owner
Home Financials are based on the most recent Mortgage that was taken out on this home.
Original Mortgage
$291,200
Interest Rate
10.9%
Mortgage Type
Purchase Money Mortgage
Purchase Details
Closed on
Jan 12, 1987
Sold by
Flack Robert
Bought by
Roukos Salim
Create a Home Valuation Report for This Property
The Home Valuation Report is an in-depth analysis detailing your home's value as well as a comparison with similar homes in the area
Home Values in the Area
Average Home Value in this Area
Purchase History
| Date | Buyer | Sale Price | Title Company |
|---|---|---|---|
| Oconnor Rory A | -- | -- | |
| Oconnor Rory A | $900,000 | -- | |
| Selig Mark A | $416,000 | -- | |
| Selig Mark A | $416,000 | -- | |
| Roukos Salim | $358,000 | -- |
Source: Public Records
Mortgage History
| Date | Status | Borrower | Loan Amount |
|---|---|---|---|
| Open | Oconnor Rory A | $75,000 | |
| Previous Owner | Selig Mark A | $50,000 | |
| Previous Owner | Selig Mark A | $270,000 | |
| Previous Owner | Roukos Salim | $286,500 | |
| Previous Owner | Roukos Salim | $650,000 | |
| Previous Owner | Roukos Salim | $291,200 |
Source: Public Records
Property History
| Date | Event | Price | Change | Sq Ft Price |
|---|---|---|---|---|
| 02/10/2025 02/10/25 | Off Market | $7,750 | -- | -- |
| 01/13/2025 01/13/25 | For Rent | -- | -- | -- |
| 10/08/2024 10/08/24 | Off Market | $7,750 | -- | -- |
| 06/01/2024 06/01/24 | For Rent | $7,750 | 0.0% | -- |
| 06/01/2024 06/01/24 | For Rent | $7,750 | -- | -- |
Tax History Compared to Growth
Tax History
| Year | Tax Paid | Tax Assessment Tax Assessment Total Assessment is a certain percentage of the fair market value that is determined by local assessors to be the total taxable value of land and additions on the property. | Land | Improvement |
|---|---|---|---|---|
| 2025 | $14,542 | $2,290,100 | $890,300 | $1,399,800 |
| 2024 | $13,280 | $2,243,300 | $902,300 | $1,341,000 |
| 2023 | $9,738 | $1,661,800 | $870,600 | $791,200 |
| 2022 | $9,310 | $1,572,700 | $871,200 | $701,500 |
| 2021 | $8,922 | $1,525,100 | $857,900 | $667,200 |
| 2020 | $8,451 | $1,469,800 | $836,500 | $633,300 |
| 2019 | $7,840 | $1,319,900 | $733,500 | $586,400 |
| 2018 | $8,184 | $1,301,100 | $729,200 | $571,900 |
| 2017 | $8,277 | $1,275,400 | $729,200 | $546,200 |
| 2016 | $8,048 | $1,151,300 | $641,300 | $510,000 |
| 2015 | $8,189 | $1,047,200 | $589,800 | $457,400 |
| 2014 | $8,277 | $987,700 | $536,200 | $451,500 |
Source: Public Records
Map
Nearby Homes
- 11 Brown St
- 92 Foster St Unit 94
- 20 Maynard Place
- 15 Hubbard Park Rd
- 7 Gibson St Unit 7
- 159 Mount Auburn St
- 1010 Memorial Dr Unit 3F
- 1010 Memorial Dr Unit 6G
- 33 Ash St Unit 33
- 988 Memorial Dr Unit 287
- 18 Ash St
- 12 Ash Street Place
- 17 Berkeley St
- 11 Longfellow Rd
- 57 Brewster St
- 984 Memorial Dr Unit 503
- 14 Concord Ave Unit 416
- 14 Concord Ave Unit 422
- 130 Mount Auburn St Unit 108
- 29 Concord Ave Unit 608
- 9 Foster Plaza
- 9 Foster Place
- 9 Foster Place Unit foster place cambrid
- 9 Foster Place Unit R
- 9 Foster Place Unit T
- 9 Foster Place Unit SF
- 9 Foster Place
- 9 Foster Place Unit 1
- 7 Foster Place
- 10 Foster Place
- 8 Foster Place
- 4 Mercer Cir
- 5 Foster Place
- 2 Foster Place
- 15 Brown St
- 61 Foster St
- 3 Mercer Cir
- 17 Brown St
- 53 Foster St
- 9 Brown St