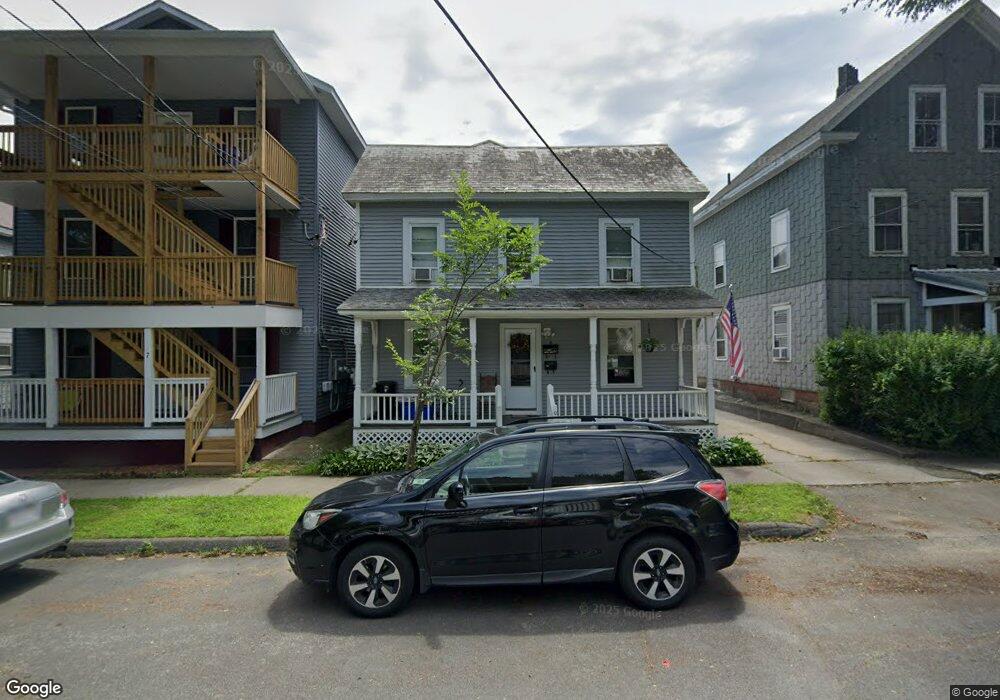
9 G St Turners Falls, MA 01376
Estimated Value: $214,000 - $338,000
4
Beds
2
Baths
2,128
Sq Ft
$139/Sq Ft
Est. Value
About This Home
This home is located at 9 G St, Turners Falls, MA 01376 and is currently estimated at $295,921, approximately $139 per square foot. 9 G St is a home located in Franklin County with nearby schools including Holy Trinity School and Four Winds School.
Ownership History
Date
Name
Owned For
Owner Type
Purchase Details
Closed on
Dec 20, 2021
Sold by
Allen Robert G and Allen Debra L
Bought by
Allen Ft and Allen
Current Estimated Value
Purchase Details
Closed on
May 13, 2004
Sold by
Morgan Arthur L
Bought by
Allen Debra L R and Allen Robert G
Home Financials for this Owner
Home Financials are based on the most recent Mortgage that was taken out on this home.
Original Mortgage
$99,200
Interest Rate
5.47%
Mortgage Type
Purchase Money Mortgage
Purchase Details
Closed on
Jun 28, 2001
Sold by
Schwartz Damien and Nasca Andrea Marie
Bought by
Morgan Arthur L and Morgan Patricia J
Home Financials for this Owner
Home Financials are based on the most recent Mortgage that was taken out on this home.
Original Mortgage
$73,384
Interest Rate
7.14%
Mortgage Type
Purchase Money Mortgage
Purchase Details
Closed on
Feb 1, 2000
Sold by
Campbell Hugh W and Campbell Sara E
Bought by
Nasca Andrea Marie and Schwartz Damien
Purchase Details
Closed on
Jan 5, 1989
Sold by
Ryan Stephanie
Bought by
Campbell Hugh W
Create a Home Valuation Report for This Property
The Home Valuation Report is an in-depth analysis detailing your home's value as well as a comparison with similar homes in the area
Home Values in the Area
Average Home Value in this Area
Purchase History
| Date | Buyer | Sale Price | Title Company |
|---|---|---|---|
| Allen Ft | -- | None Available | |
| Allen Ft | -- | None Available | |
| Allen Debra L R | $124,000 | -- | |
| Allen Debra L R | $124,000 | -- | |
| Morgan Arthur L | $74,000 | -- | |
| Morgan Arthur L | $74,000 | -- | |
| Nasca Andrea Marie | $61,850 | -- | |
| Nasca Andrea Marie | $61,850 | -- | |
| Campbell Hugh W | $77,000 | -- |
Source: Public Records
Mortgage History
| Date | Status | Borrower | Loan Amount |
|---|---|---|---|
| Previous Owner | Campbell Hugh W | $99,200 | |
| Previous Owner | Campbell Hugh W | $73,384 |
Source: Public Records
Tax History Compared to Growth
Tax History
| Year | Tax Paid | Tax Assessment Tax Assessment Total Assessment is a certain percentage of the fair market value that is determined by local assessors to be the total taxable value of land and additions on the property. | Land | Improvement |
|---|---|---|---|---|
| 2025 | $3,597 | $236,500 | $51,900 | $184,600 |
| 2024 | $3,366 | $214,400 | $51,900 | $162,500 |
| 2023 | $3,143 | $200,800 | $51,900 | $148,900 |
| 2022 | $3,084 | $184,000 | $51,900 | $132,100 |
| 2021 | $3,546 | $171,100 | $38,900 | $132,200 |
| 2020 | $2,843 | $161,800 | $38,900 | $122,900 |
| 2019 | $2,691 | $157,100 | $49,200 | $107,900 |
| 2018 | $2,685 | $157,100 | $49,200 | $107,900 |
| 2017 | $2,581 | $154,800 | $49,200 | $105,600 |
| 2016 | $2,464 | $139,900 | $36,800 | $103,100 |
| 2015 | $2,373 | $139,900 | $36,800 | $103,100 |
| 2014 | $2,286 | $139,900 | $36,800 | $103,100 |
Source: Public Records
Map
Nearby Homes
- 30 Park St
- 0 Millers Falls Rd Unit 73034825
- 21 Hillside Ave
- 79 Burnham Rd
- 45 Millers Falls Rd
- 89 Montague St
- 114 Montague St
- 2 Alice St
- 696 Bernardston Rd
- 202 Turnpike Rd
- 335 Federal St
- 72 Meadowood Dr
- 93 Maple St
- 35-37 Shattuck St
- 35 Shattuck St Unit 37
- 001 Adams Rd
- 183 Millers Falls Rd
- 55 A + B Randall Rd
- 31 Lovers Ln
- 306 Davis St