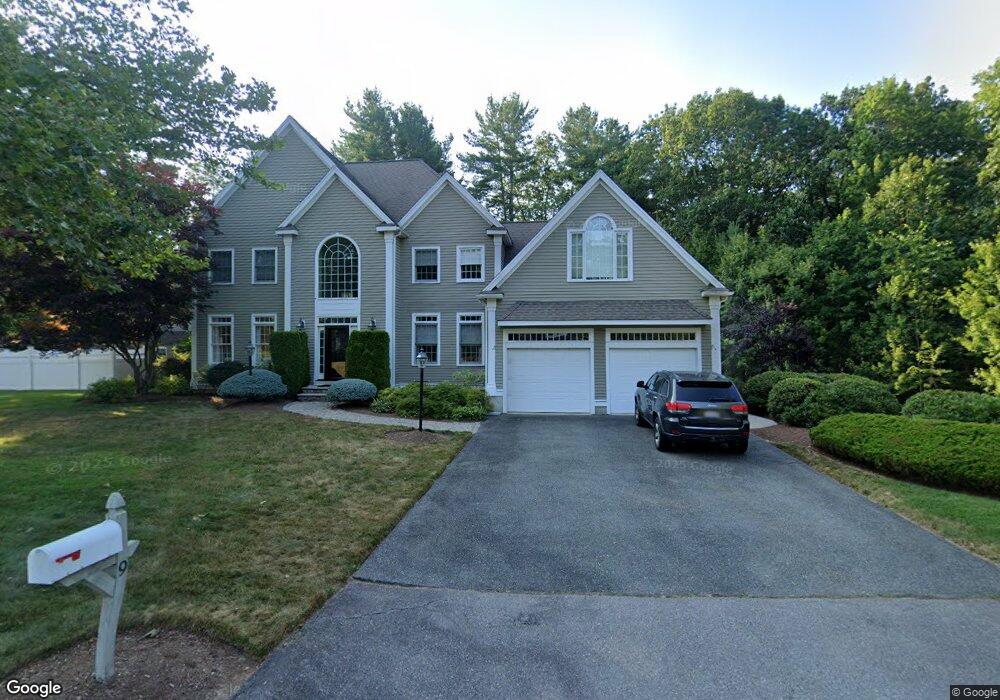
9 Galeucia Rd Middleton, MA 01949
Estimated Value: $1,385,000 - $1,533,267
4
Beds
3
Baths
4,200
Sq Ft
$349/Sq Ft
Est. Value
About This Home
This home is located at 9 Galeucia Rd, Middleton, MA 01949 and is currently estimated at $1,465,317, approximately $348 per square foot. 9 Galeucia Rd is a home located in Essex County with nearby schools including Howe-Manning Elementary School, Fuller Meadow Elementary School, and Masconomet Regional Middle School.
Ownership History
Date
Name
Owned For
Owner Type
Purchase Details
Closed on
Jul 16, 2003
Sold by
Mclaren Kyle E
Bought by
Farina Douglas A and Farina Leah L
Current Estimated Value
Purchase Details
Closed on
Dec 1, 2000
Sold by
Stabile Denise L
Bought by
Mclaren Kyle E
Purchase Details
Closed on
Jun 30, 1998
Sold by
Mckenelley Brent L and Davolio Eugene
Bought by
Stabile Denise L
Purchase Details
Closed on
May 21, 1998
Sold by
Woodstone Est Corp
Bought by
Mckenelley Brent L and Davolio Eugene
Create a Home Valuation Report for This Property
The Home Valuation Report is an in-depth analysis detailing your home's value as well as a comparison with similar homes in the area
Home Values in the Area
Average Home Value in this Area
Purchase History
| Date | Buyer | Sale Price | Title Company |
|---|---|---|---|
| Farina Douglas A | $795,000 | -- | |
| Farina Douglas A | $795,000 | -- | |
| Mclaren Kyle E | $769,900 | -- | |
| Mclaren Kyle E | $769,900 | -- | |
| Stabile Denise L | $442,500 | -- | |
| Stabile Denise L | $442,500 | -- | |
| Mckenelley Brent L | $166,225 | -- | |
| Mckenelley Brent L | $166,225 | -- |
Source: Public Records
Mortgage History
| Date | Status | Borrower | Loan Amount |
|---|---|---|---|
| Open | Mckenelley Brent L | $300,000 | |
| Closed | Mckenelley Brent L | $417,000 |
Source: Public Records
Tax History Compared to Growth
Tax History
| Year | Tax Paid | Tax Assessment Tax Assessment Total Assessment is a certain percentage of the fair market value that is determined by local assessors to be the total taxable value of land and additions on the property. | Land | Improvement |
|---|---|---|---|---|
| 2025 | $14,333 | $1,205,500 | $457,700 | $747,800 |
| 2024 | $14,919 | $1,265,400 | $527,700 | $737,700 |
| 2023 | $15,193 | $1,180,500 | $629,700 | $550,800 |
| 2022 | $11,241 | $848,400 | $352,600 | $495,800 |
| 2021 | $11,346 | $827,000 | $350,600 | $476,400 |
| 2020 | $11,287 | $828,700 | $350,600 | $478,100 |
| 2019 | $10,596 | $774,000 | $304,600 | $469,400 |
| 2018 | $10,564 | $756,700 | $304,600 | $452,100 |
| 2017 | $10,769 | $772,000 | $326,600 | $445,400 |
| 2016 | $9,656 | $695,200 | $256,600 | $438,600 |
| 2015 | $9,967 | $723,300 | $286,600 | $436,700 |
Source: Public Records
Map
Nearby Homes
- 2 Tyler Ln
- 15 Couture Way
- 62 Cabral Dr
- 6 White Ln
- 1 Overbrook Rd
- 1 Couture Way
- 119 River St
- 1 Mills Point Unit 1
- 8 Brookside Rd
- 28 Niblick Way
- 37 Peaslee Cir Unit 37
- 44 Brassie Way
- 5 Theresa Rd
- 49 Maple St Unit B
- 39 Central St
- 53 N Main St Unit 53
- 103 Elm St
- 1466 Main St
- 62 Catherine Dr
- Beverly Plan at Willis Brook at Lynnfield