Estimated Value: $302,173 - $329,000
3
Beds
2
Baths
1,785
Sq Ft
$178/Sq Ft
Est. Value
About This Home
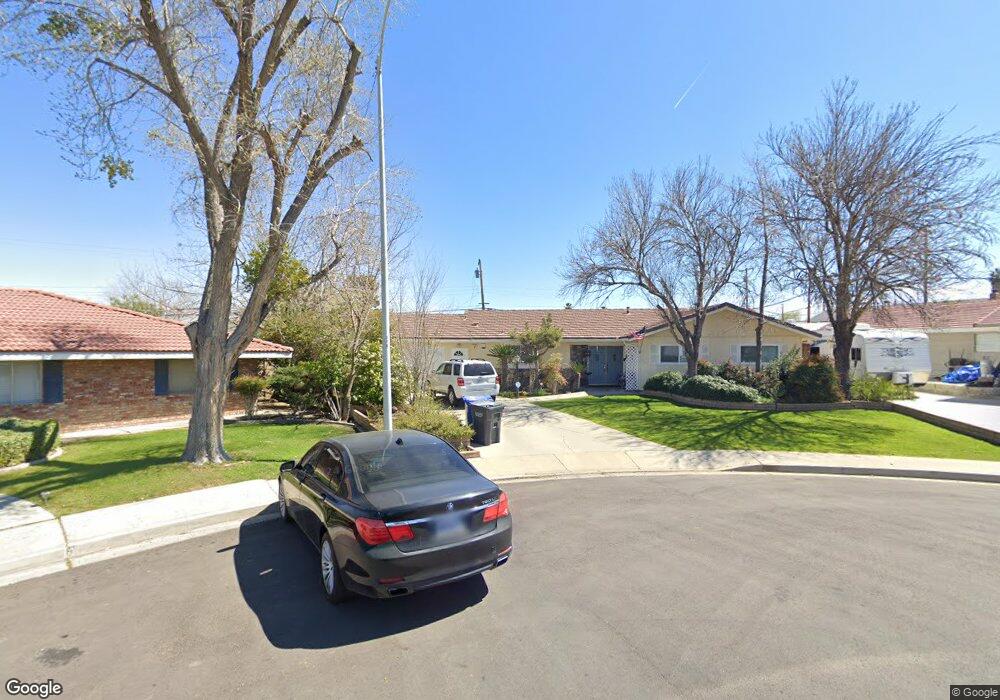
This home is located at 9 Grey Way, Taft, CA 93268 and is currently estimated at $317,793, approximately $178 per square foot. 9 Grey Way is a home located in Kern County with nearby schools including Parkview Elementary School, Roosevelt Elementary School, and Lincoln Junior High School.
Ownership History
Date
Name
Owned For
Owner Type
Purchase Details
Closed on
Apr 15, 2021
Sold by
Hillygus Karen A and The Karen A Hillygus Trust
Bought by
Comstock Tamara Lynn and Comstock Harvey Leland
Current Estimated Value
Purchase Details
Closed on
Jun 17, 2020
Sold by
Hillygus Karen A and The Stanley D And Karen A Hill
Bought by
Hillygus Karen A and Karen A Hillygus Trust
Purchase Details
Closed on
Dec 5, 2007
Sold by
Hillygus Stanley D and Hillygus Karen A
Bought by
Hillygus Stanley D and Hillygus Karen A
Purchase Details
Closed on
Nov 20, 2000
Sold by
Smith Charles E and Smith Joanna K
Bought by
Hillygus Stanley D and Hillygus Karen A
Home Financials for this Owner
Home Financials are based on the most recent Mortgage that was taken out on this home.
Original Mortgage
$116,000
Interest Rate
7.71%
Purchase Details
Closed on
Dec 11, 1998
Sold by
Smith Charles E and Smith Joanna K
Bought by
Smith Charles E and Smith Joanna K
Create a Home Valuation Report for This Property
The Home Valuation Report is an in-depth analysis detailing your home's value as well as a comparison with similar homes in the area
Home Values in the Area
Average Home Value in this Area
Purchase History
| Date | Buyer | Sale Price | Title Company |
|---|---|---|---|
| Comstock Tamara Lynn | $200,000 | Ticor Title Company | |
| Hillygus Karen A | -- | None Available | |
| Hillygus Stanley D | -- | None Available | |
| Hillygus Stanley D | $145,000 | -- | |
| Smith Charles E | -- | -- |
Source: Public Records
Mortgage History
| Date | Status | Borrower | Loan Amount |
|---|---|---|---|
| Previous Owner | Hillygus Stanley D | $116,000 |
Source: Public Records
Tax History
| Year | Tax Paid | Tax Assessment Tax Assessment Total Assessment is a certain percentage of the fair market value that is determined by local assessors to be the total taxable value of land and additions on the property. | Land | Improvement |
|---|---|---|---|---|
| 2025 | $4,079 | $241,380 | $37,884 | $203,496 |
| 2024 | $4,079 | $236,648 | $37,142 | $199,506 |
| 2023 | $3,823 | $232,009 | $36,414 | $195,595 |
| 2022 | $3,672 | $227,460 | $35,700 | $191,760 |
| 2021 | $3,253 | $201,833 | $41,751 | $160,082 |
| 2020 | $2,973 | $199,764 | $41,323 | $158,441 |
| 2019 | $2,931 | $199,764 | $41,323 | $158,441 |
| 2018 | $2,875 | $192,009 | $39,719 | $152,290 |
| 2017 | $2,788 | $188,245 | $38,941 | $149,304 |
| 2016 | $2,884 | $184,555 | $38,178 | $146,377 |
| 2015 | $2,644 | $181,784 | $37,605 | $144,179 |
| 2014 | $2,497 | $178,224 | $36,869 | $141,355 |
Source: Public Records
Map
Nearby Homes
Your Personal Tour Guide
Ask me questions while you tour the home.