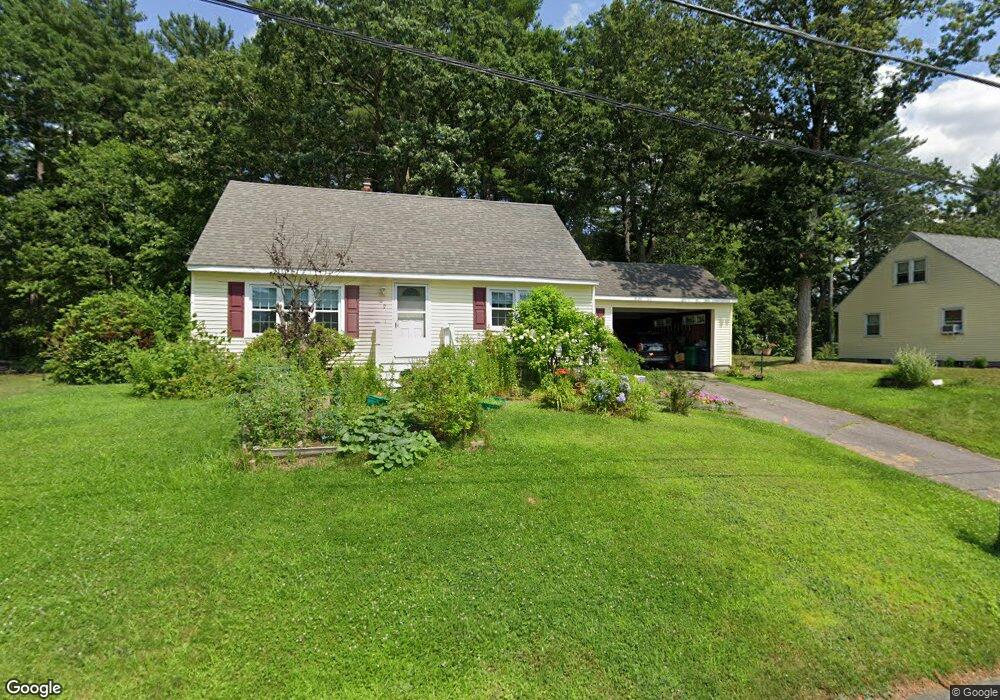
9 Hideaway Rd Nashua, NH 03064
Northeast Nashua NeighborhoodEstimated Value: $505,765 - $564,000
3
Beds
2
Baths
1,553
Sq Ft
$342/Sq Ft
Est. Value
About This Home
This home is located at 9 Hideaway Rd, Nashua, NH 03064 and is currently estimated at $531,691, approximately $342 per square foot. 9 Hideaway Rd is a home located in Hillsborough County with nearby schools including Charlotte Ave Elementary School, Pennichuck Middle School, and Nashua High School North.
Ownership History
Date
Name
Owned For
Owner Type
Purchase Details
Closed on
Jan 12, 2005
Sold by
Dubay Robert R and Dubay Barbara A
Bought by
Blackwell Julie
Current Estimated Value
Home Financials for this Owner
Home Financials are based on the most recent Mortgage that was taken out on this home.
Original Mortgage
$160,000
Interest Rate
5.81%
Mortgage Type
Purchase Money Mortgage
Purchase Details
Closed on
Jun 17, 2002
Sold by
Disario Joseph W and Disario Jacqueline M
Bought by
Dubay Robert R and Dubay Barbara A
Home Financials for this Owner
Home Financials are based on the most recent Mortgage that was taken out on this home.
Original Mortgage
$200,900
Interest Rate
6.8%
Mortgage Type
Purchase Money Mortgage
Purchase Details
Closed on
Nov 29, 1999
Sold by
Robes John and Robes Sally R
Bought by
Disario Joseph W and Disario Jacqueline M
Create a Home Valuation Report for This Property
The Home Valuation Report is an in-depth analysis detailing your home's value as well as a comparison with similar homes in the area
Home Values in the Area
Average Home Value in this Area
Purchase History
| Date | Buyer | Sale Price | Title Company |
|---|---|---|---|
| Blackwell Julie | $268,000 | -- | |
| Dubay Robert R | $197,000 | -- | |
| Disario Joseph W | $140,000 | -- |
Source: Public Records
Mortgage History
| Date | Status | Borrower | Loan Amount |
|---|---|---|---|
| Open | Disario Joseph W | $180,000 | |
| Closed | Disario Joseph W | $10,000 | |
| Closed | Disario Joseph W | $160,000 | |
| Previous Owner | Disario Joseph W | $200,900 |
Source: Public Records
Tax History
| Year | Tax Paid | Tax Assessment Tax Assessment Total Assessment is a certain percentage of the fair market value that is determined by local assessors to be the total taxable value of land and additions on the property. | Land | Improvement |
|---|---|---|---|---|
| 2025 | $7,491 | $445,100 | $159,200 | $285,900 |
| 2024 | $7,077 | $445,100 | $159,200 | $285,900 |
| 2023 | $6,654 | $365,000 | $127,400 | $237,600 |
| 2022 | $6,596 | $365,000 | $127,400 | $237,600 |
| 2021 | $5,965 | $256,900 | $84,900 | $172,000 |
| 2020 | $5,768 | $255,100 | $84,900 | $170,200 |
| 2019 | $5,551 | $255,100 | $84,900 | $170,200 |
| 2018 | $5,411 | $255,100 | $84,900 | $170,200 |
| 2017 | $5,308 | $205,800 | $69,300 | $136,500 |
| 2016 | $5,159 | $205,800 | $69,300 | $136,500 |
| 2015 | $5,048 | $205,800 | $69,300 | $136,500 |
| 2014 | $4,949 | $205,800 | $69,300 | $136,500 |
Source: Public Records
Map
Nearby Homes
- 21 Todd Rd
- 10 Todd Rd
- 14 Terry St
- 7 Mount Vernon St
- 3 Paddington Place
- 36 Beauview Ave
- 63 Cannongate III Unit 3
- 11 Pine Hill Ave
- 7 Buker St
- 44 Broad St
- 3 Kirk St Unit 57
- 16 Juliana Ave
- 10 Juliana Ave
- 9 Rugby Rd
- 3 Opal Way Unit 3
- 1 Opal Way Unit 1
- 2 Opal Way Unit 2
- 12 Juliana Ave Unit 14
- 11 Juliana Ave Unit 52
- 19 Bartlett Ave
Your Personal Tour Guide
Ask me questions while you tour the home.