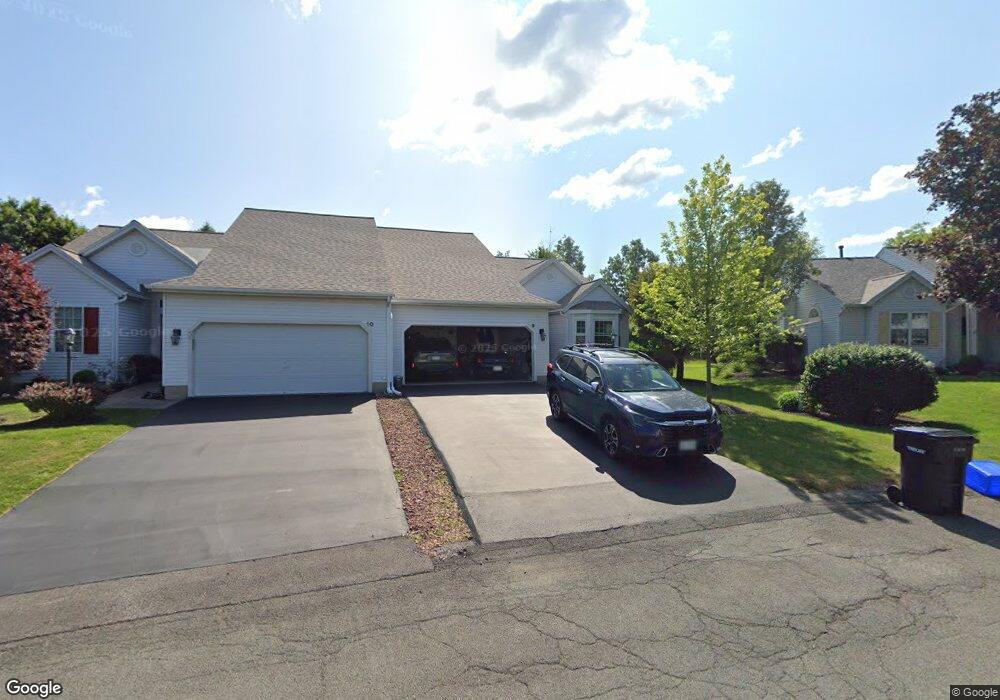
9 Hyland Cir Troy, NY 12182
Lansingburgh NeighborhoodEstimated Value: $314,000 - $364,000
2
Beds
3
Baths
1,670
Sq Ft
$201/Sq Ft
Est. Value
About This Home
This home is located at 9 Hyland Cir, Troy, NY 12182 and is currently estimated at $336,438, approximately $201 per square foot. 9 Hyland Cir is a home located in Rensselaer County with nearby schools including Turnpike Elementary School, Rensselaer Park Elementary School, and Knickerbacker Middle School.
Ownership History
Date
Name
Owned For
Owner Type
Purchase Details
Closed on
Jun 23, 2020
Sold by
Pechenik Prudence M and Golino Rosina
Bought by
Fowler Frederick L and Fowler Janet L
Current Estimated Value
Home Financials for this Owner
Home Financials are based on the most recent Mortgage that was taken out on this home.
Original Mortgage
$186,000
Outstanding Balance
$164,564
Interest Rate
3.1%
Mortgage Type
Purchase Money Mortgage
Estimated Equity
$171,874
Purchase Details
Closed on
Dec 24, 1997
Purchase Details
Closed on
Dec 23, 1997
Sold by
The Michaels Development
Bought by
Pechenik Prudence M
Create a Home Valuation Report for This Property
The Home Valuation Report is an in-depth analysis detailing your home's value as well as a comparison with similar homes in the area
Home Values in the Area
Average Home Value in this Area
Purchase History
| Date | Buyer | Sale Price | Title Company |
|---|---|---|---|
| Fowler Frederick L | $232,500 | None Available | |
| -- | -- | -- | |
| Pechenik Prudence M | $147,450 | -- |
Source: Public Records
Mortgage History
| Date | Status | Borrower | Loan Amount |
|---|---|---|---|
| Open | Fowler Frederick L | $186,000 |
Source: Public Records
Tax History Compared to Growth
Tax History
| Year | Tax Paid | Tax Assessment Tax Assessment Total Assessment is a certain percentage of the fair market value that is determined by local assessors to be the total taxable value of land and additions on the property. | Land | Improvement |
|---|---|---|---|---|
| 2024 | $3,738 | $175,000 | $30,000 | $145,000 |
| 2023 | $7,841 | $175,000 | $30,000 | $145,000 |
| 2022 | $4,070 | $175,000 | $30,000 | $145,000 |
| 2021 | $1,993 | $175,000 | $30,000 | $145,000 |
| 2020 | $2,960 | $170,000 | $30,000 | $140,000 |
| 2019 | $2,822 | $170,000 | $30,000 | $140,000 |
| 2018 | $4,275 | $170,000 | $30,000 | $140,000 |
| 2017 | $5,380 | $170,000 | $30,000 | $140,000 |
| 2016 | $5,620 | $170,000 | $30,000 | $140,000 |
| 2015 | -- | $170,000 | $30,000 | $140,000 |
| 2014 | -- | $170,000 | $30,000 | $140,000 |
Source: Public Records
Map
Nearby Homes