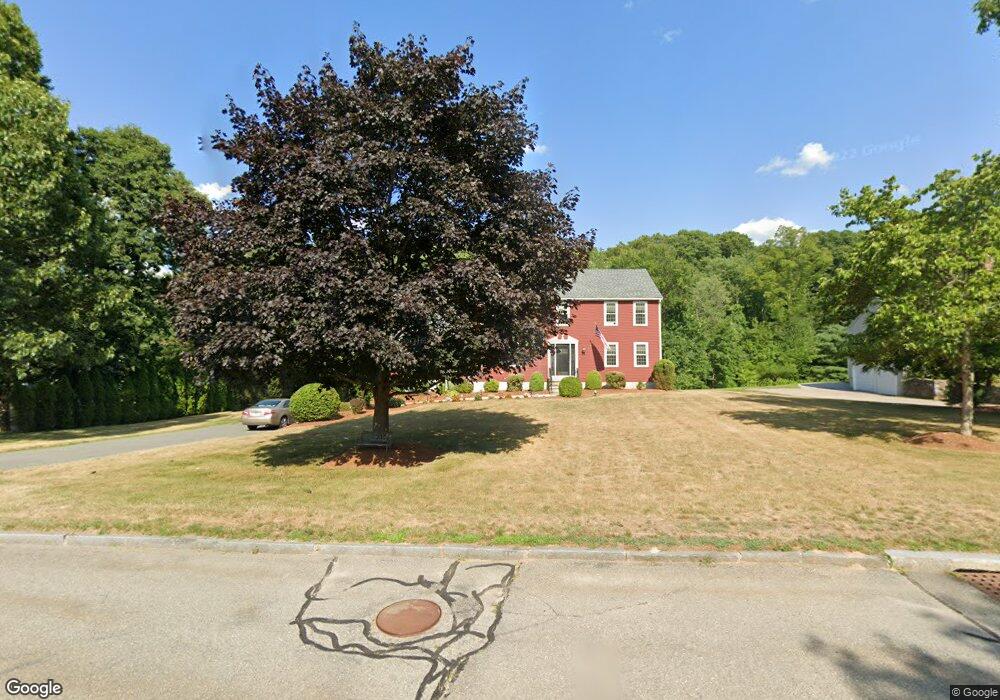
9 Jencks Rd Milford, MA 01757
Estimated Value: $670,000 - $786,000
4
Beds
3
Baths
2,606
Sq Ft
$284/Sq Ft
Est. Value
About This Home
This home is located at 9 Jencks Rd, Milford, MA 01757 and is currently estimated at $739,237, approximately $283 per square foot. 9 Jencks Rd is a home located in Worcester County with nearby schools including Milford High School and Bethany Christian Academy.
Ownership History
Date
Name
Owned For
Owner Type
Purchase Details
Closed on
Jul 24, 2020
Sold by
Leverone Richard A and Leverone Maureen P
Bought by
Richard A Leverone Ret
Current Estimated Value
Purchase Details
Closed on
Aug 12, 1993
Sold by
D&F Afonso Rt and Faonso Domingos
Bought by
Leverone Richard A and Leverone Maureen
Home Financials for this Owner
Home Financials are based on the most recent Mortgage that was taken out on this home.
Original Mortgage
$135,000
Interest Rate
7.16%
Mortgage Type
Purchase Money Mortgage
Create a Home Valuation Report for This Property
The Home Valuation Report is an in-depth analysis detailing your home's value as well as a comparison with similar homes in the area
Home Values in the Area
Average Home Value in this Area
Purchase History
| Date | Buyer | Sale Price | Title Company |
|---|---|---|---|
| Richard A Leverone Ret | -- | None Available | |
| Leverone Richard A | $208,445 | -- |
Source: Public Records
Mortgage History
| Date | Status | Borrower | Loan Amount |
|---|---|---|---|
| Previous Owner | Leverone Richard A | $105,000 | |
| Previous Owner | Leverone Richard A | $58,000 | |
| Previous Owner | Leverone Richard A | $29,500 | |
| Previous Owner | Leverone Richard A | $135,000 |
Source: Public Records
Tax History Compared to Growth
Tax History
| Year | Tax Paid | Tax Assessment Tax Assessment Total Assessment is a certain percentage of the fair market value that is determined by local assessors to be the total taxable value of land and additions on the property. | Land | Improvement |
|---|---|---|---|---|
| 2025 | $8,119 | $634,300 | $208,600 | $425,700 |
| 2024 | $8,042 | $605,100 | $200,700 | $404,400 |
| 2023 | $7,481 | $517,700 | $167,100 | $350,600 |
| 2022 | $7,039 | $457,400 | $153,400 | $304,000 |
| 2021 | $6,704 | $419,500 | $153,400 | $266,100 |
| 2020 | $6,619 | $414,700 | $153,400 | $261,300 |
| 2019 | $6,614 | $399,900 | $153,400 | $246,500 |
| 2018 | $6,558 | $396,000 | $149,500 | $246,500 |
| 2017 | $6,348 | $378,100 | $149,500 | $228,600 |
| 2016 | $6,226 | $362,400 | $149,500 | $212,900 |
| 2015 | $6,195 | $353,000 | $149,500 | $203,500 |
Source: Public Records
Map
Nearby Homes
- 48 Black Bear Cir Unit 48
- 43 Black Bear Cir Unit 43
- 11 Black Bear Unit 11
- 9 Black Bear Cir Unit 9
- 7 Black Bear Unit 7
- 3 Black Bear Cir Unit 3
- 10 Black Bear Unit 10
- 33 Brown Bear Ln Unit 33
- 23 Christina Rd
- 9 Hillside Ave
- 35 Woodland Ave Unit 35A
- 97 E Street Extension
- 3 S Central St
- 22 Granite St
- 57 Beach St
- 9 Tulip Way
- 22 Roger Belanger Dr
- 6 Rainbow Dr
- 29 Rawson Rd
- 17 Middleton St