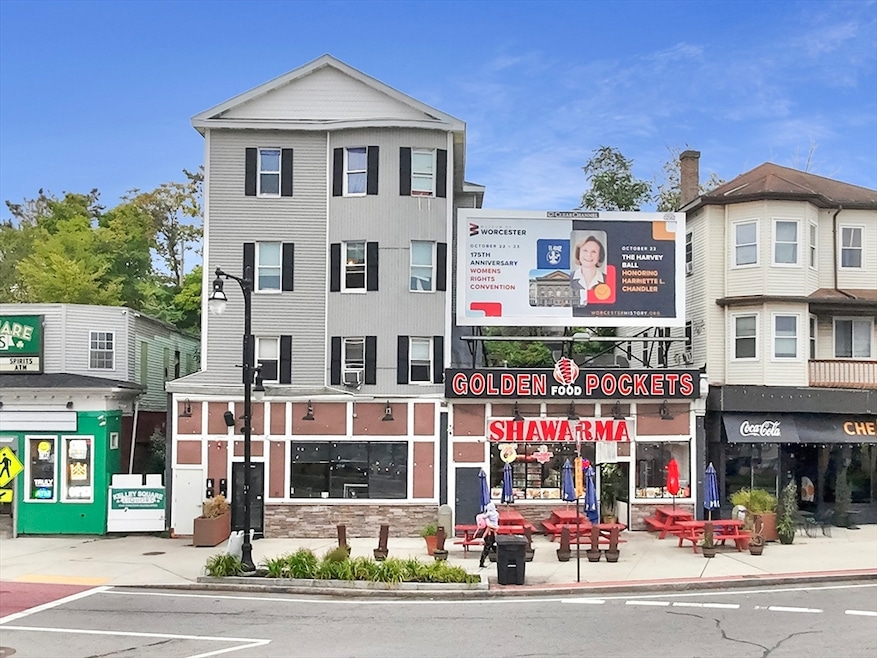
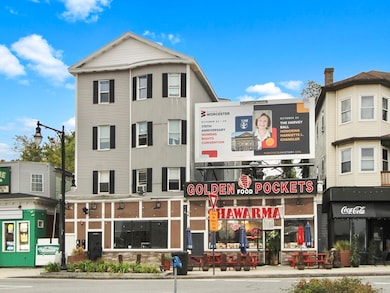
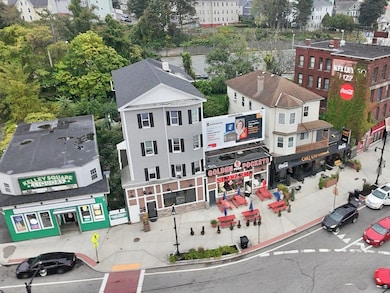

9 Kelley Square Worcester, MA 01610
Green Island NeighborhoodEstimated payment $7,079/month
About This Home
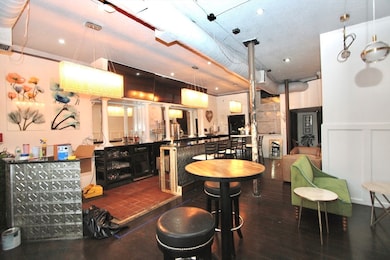
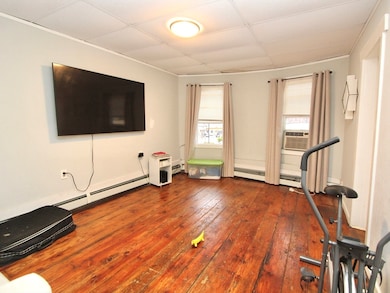
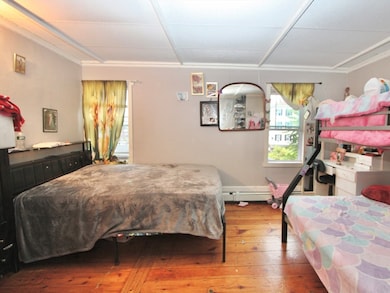
Incredible Investment Opportunity in the Heart of Kelley Square! This mixed-use 4-family property offers unbeatable visibility and value in Worcester’s hottest neighborhood. The first floor features a versatile commercial space currently leased to a restaurant - ideal for high foot traffic and proximity to Polar Park, the Canal District, and new developments. Above are three spacious 4-bedroom residential units, each offering strong rental income potential. Units are well-maintained with separate utilities, updated systems, and solid tenancy. Zoned BG-3, allowing for flexible commercial uses and future development upside. Billboard lease also brings in an additional $5500 a year. Whether you're an investor looking for cash flow or a business owner seeking live/work potential, this property checks all the boxes. Don't miss your chance to own a cornerstone in Worcester’s fastest-growing district!
Property Details
Home Type
- Multi-Family
Est. Annual Taxes
- $12,065
Year Built
- Built in 1900
Lot Details
- 4,872 Sq Ft Lot
- Irregular Lot
Home Design
- Quadruplex
- Stone Foundation
Interior Spaces
- 6,998 Sq Ft Home
- Property has 1 Level
- City Views
Bedrooms and Bathrooms
- 12 Bedrooms
Community Details
- 4 Units
- Net Operating Income $133,492
Listing and Financial Details
- Assessor Parcel Number M:04 B:038 L:00033
Map
Home Values in the Area
Average Home Value in this Area
Tax History
| Year | Tax Paid | Tax Assessment Tax Assessment Total Assessment is a certain percentage of the fair market value that is determined by local assessors to be the total taxable value of land and additions on the property. | Land | Improvement |
|---|---|---|---|---|
| 2025 | -- | $914,700 | $115,300 | $799,400 |
| 2024 | -- | $710,100 | $115,300 | $594,800 |
| 2023 | $0 | $969,500 | $100,200 | $869,300 |
| 2022 | $0 | $773,600 | $80,200 | $693,400 |
| 2021 | $0 | $623,700 | $64,200 | $559,500 |
| 2020 | $8,788 | $392,300 | $56,000 | $336,300 |
| 2019 | $0 | $369,700 | $52,900 | $316,800 |
| 2018 | $0 | $369,700 | $52,900 | $316,800 |
| 2017 | $0 | $369,700 | $52,900 | $316,800 |
| 2016 | -- | $352,000 | $39,800 | $312,200 |
| 2015 | -- | $352,000 | $39,800 | $312,200 |
| 2014 | -- | $352,000 | $39,800 | $312,200 |
Property History
| Date | Event | Price | List to Sale | Price per Sq Ft |
|---|---|---|---|---|
| 10/30/2025 10/30/25 | For Sale | $1,150,000 | 0.0% | $164 / Sq Ft |
| 10/07/2025 10/07/25 | Pending | -- | -- | -- |
| 10/01/2025 10/01/25 | For Sale | $1,150,000 | -- | $164 / Sq Ft |
Purchase History
| Date | Type | Sale Price | Title Company |
|---|---|---|---|
| Not Resolvable | $650,000 | Metropolitan Title Agency | |
| Deed | $340,000 | -- |
Mortgage History
| Date | Status | Loan Amount | Loan Type |
|---|---|---|---|
| Open | $520,000 | Purchase Money Mortgage | |
| Previous Owner | $250,000 | Commercial |
Source: MLS Property Information Network (MLS PIN)
MLS Number: 73438059
APN: WORC-000004-000038-000033
Disclaimer: Certain information contained herein is derived from information provided by parties other than Homes.com. All information provided is deemed reliable, but is not guaranteed to be accurate and should be independently verified.
![]() The property listing data and information, or the Images, set forth herein were provided to MLS Property Information Network, Inc. from third party sources, including sellers, lessors and public records, and were compiled by MLS Property Information Network, Inc. The property listing data and information, and the Images, are for the personal, non-commercial use of consumers having a good faith interest in purchasing or leasing listed properties of the type displayed to them and may not be used for any purpose other than to identify prospective properties which such consumers may have a good faith interest in purchasing or leasing. MLS Property Information Network, Inc. and its subscribers disclaim any and all representations and warranties as to the accuracy of the property listing data and information, or as to the accuracy of any of the Images, set forth herein.
The property listing data and information, or the Images, set forth herein were provided to MLS Property Information Network, Inc. from third party sources, including sellers, lessors and public records, and were compiled by MLS Property Information Network, Inc. The property listing data and information, and the Images, are for the personal, non-commercial use of consumers having a good faith interest in purchasing or leasing listed properties of the type displayed to them and may not be used for any purpose other than to identify prospective properties which such consumers may have a good faith interest in purchasing or leasing. MLS Property Information Network, Inc. and its subscribers disclaim any and all representations and warranties as to the accuracy of the property listing data and information, or as to the accuracy of any of the Images, set forth herein.
- 82 Fox St
- 71 Fox St
- 37 Vernon St
- 1 Arlington St
- 21 Dorchester St
- 52 Providence St Unit 3
- 49 Richland St
- 91 Fox St
- 340 Harding St
- 7 Lodi St
- 13 Sigel St
- 7 Winthrop St
- 9 Winthrop St
- 17 Mott St
- 33 Sigel St Unit B
- 39 Sigel St
- 70 Southbridge St Unit 215
- 70 Southbridge St Unit 310
- 40 Aetna St
- 59 Barclay St
- 150 Green St
- 153 Green St Unit 208
- 25 Columbia St Unit 3
- 27 Columbia St Unit 3
- 5 Blake St Unit 3
- 170 Washington St Unit 3
- 37 Columbia St Unit 1
- 1 Green Island Blvd
- 42 Vernon St
- 11 Pattison St Unit 3
- 85 Green St
- 48 Water St Unit 410
- 132 Millbury St Unit 2R
- 123 Endicott St Unit 2
- 55 Vernon St Unit 2
- 37 Coral St Unit 2
- 85 Harding St Unit 3A
- 47 Arlington St Unit 3
- 69 Ward St Unit 1
- 85 Seymour St Unit 1
