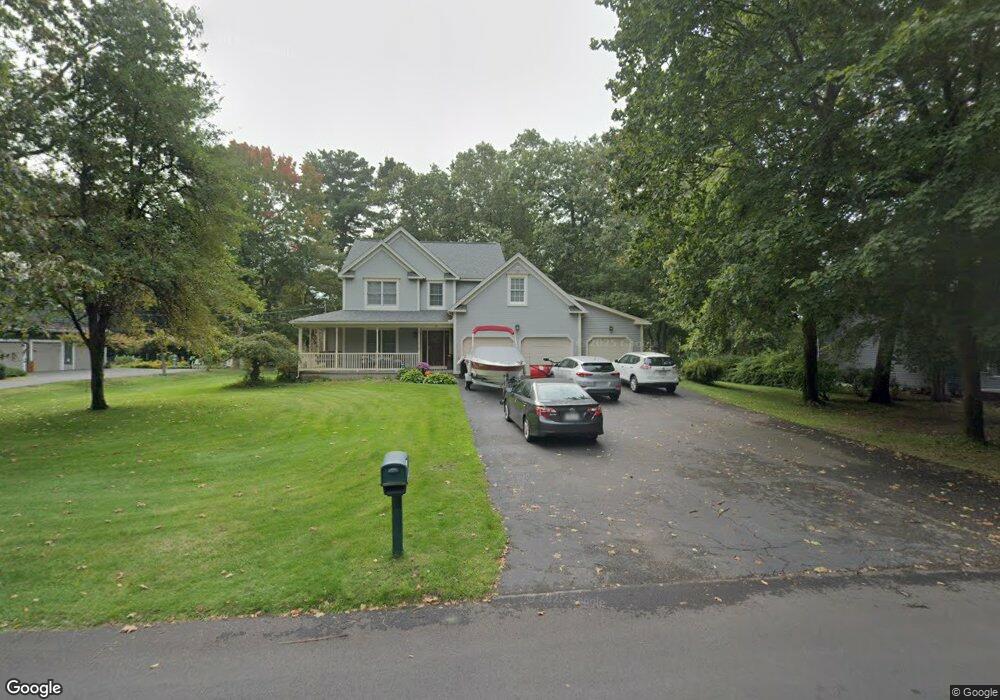
9 Lyman Terrace South Hadley, MA 01075
Estimated Value: $560,000 - $773,000
5
Beds
3
Baths
2,946
Sq Ft
$218/Sq Ft
Est. Value
About This Home
This home is located at 9 Lyman Terrace, South Hadley, MA 01075 and is currently estimated at $641,899, approximately $217 per square foot. 9 Lyman Terrace is a home located in Hampshire County with nearby schools including Plains Elementary School, Mosier Elementary School, and Michael E. Smith Middle School.
Ownership History
Date
Name
Owned For
Owner Type
Purchase Details
Closed on
Mar 31, 1998
Sold by
B&M Fitzgerald Bldrs
Bought by
Deloria Barbara Jean and Deloria Ii John R
Current Estimated Value
Home Financials for this Owner
Home Financials are based on the most recent Mortgage that was taken out on this home.
Original Mortgage
$157,000
Interest Rate
6.96%
Mortgage Type
Purchase Money Mortgage
Create a Home Valuation Report for This Property
The Home Valuation Report is an in-depth analysis detailing your home's value as well as a comparison with similar homes in the area
Home Values in the Area
Average Home Value in this Area
Purchase History
| Date | Buyer | Sale Price | Title Company |
|---|---|---|---|
| Deloria Barbara Jean | $175,500 | -- |
Source: Public Records
Mortgage History
| Date | Status | Borrower | Loan Amount |
|---|---|---|---|
| Open | Deloria Barbara Jean | $104,000 | |
| Open | Deloria Barbara Jean | $155,000 | |
| Closed | Deloria Barbara Jean | $157,000 |
Source: Public Records
Tax History Compared to Growth
Tax History
| Year | Tax Paid | Tax Assessment Tax Assessment Total Assessment is a certain percentage of the fair market value that is determined by local assessors to be the total taxable value of land and additions on the property. | Land | Improvement |
|---|---|---|---|---|
| 2025 | $8,422 | $528,700 | $113,400 | $415,300 |
| 2024 | $8,212 | $493,200 | $106,100 | $387,100 |
| 2023 | $8,155 | $464,700 | $96,300 | $368,400 |
| 2022 | $7,614 | $412,000 | $96,300 | $315,700 |
| 2021 | $7,508 | $385,800 | $89,800 | $296,000 |
| 2020 | $6,907 | $346,400 | $89,800 | $256,600 |
| 2019 | $7,419 | $368,200 | $85,600 | $282,600 |
| 2018 | $7,107 | $356,600 | $83,400 | $273,200 |
| 2017 | $6,772 | $336,600 | $83,400 | $253,200 |
| 2016 | $6,878 | $346,500 | $83,400 | $263,100 |
| 2015 | $6,519 | $336,400 | $80,900 | $255,500 |
Source: Public Records
Map
Nearby Homes
- 30 Yale St
- 0 Granby Rd
- 15 Karen Dr
- 25 Noel St
- 133 Granby Rd
- 30 Pine Grove Dr
- 63 Washington Ave
- 70 Pine Grove Dr Unit 70
- 18 Susan Ave
- 73 Pine Grove Dr
- 73 Yorktown Ct
- 318 Newton St
- 540 Granby Rd Unit 62
- 540 Granby Rd Unit 72A
- 540 Granby Rd Unit 109
- 34 Hildreth Ave
- 32 North St
- 30 Fairview Village Ct Unit 30
- 19 Hildreth Ave
- 586 Granby Rd