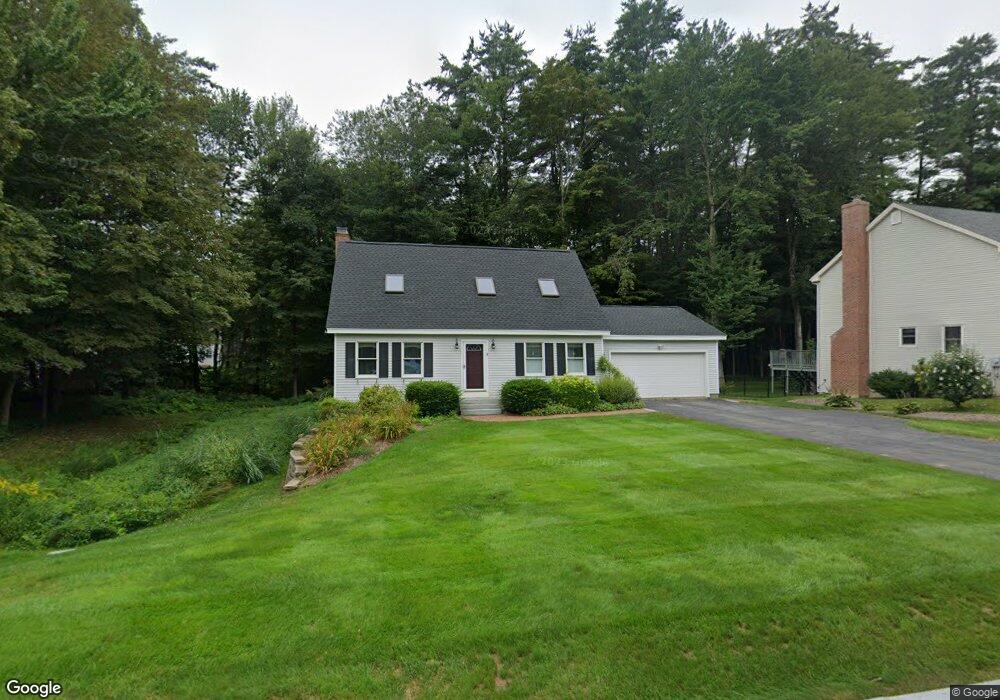
9 Madison St Concord, NH 03301
South End NeighborhoodEstimated Value: $543,000 - $626,000
3
Beds
2
Baths
1,620
Sq Ft
$353/Sq Ft
Est. Value
About This Home
This home is located at 9 Madison St, Concord, NH 03301 and is currently estimated at $572,531, approximately $353 per square foot. 9 Madison St is a home located in Merrimack County with nearby schools including Abbot-Downing School, Rundlett Middle School, and Concord High School.
Ownership History
Date
Name
Owned For
Owner Type
Purchase Details
Closed on
Nov 26, 1997
Sold by
Desjardins Kenneth M
Bought by
Sutton Karen A
Current Estimated Value
Home Financials for this Owner
Home Financials are based on the most recent Mortgage that was taken out on this home.
Original Mortgage
$65,000
Outstanding Balance
$9,117
Interest Rate
7.26%
Mortgage Type
Purchase Money Mortgage
Estimated Equity
$563,414
Create a Home Valuation Report for This Property
The Home Valuation Report is an in-depth analysis detailing your home's value as well as a comparison with similar homes in the area
Home Values in the Area
Average Home Value in this Area
Purchase History
| Date | Buyer | Sale Price | Title Company |
|---|---|---|---|
| Sutton Karen A | $160,100 | -- |
Source: Public Records
Mortgage History
| Date | Status | Borrower | Loan Amount |
|---|---|---|---|
| Open | Sutton Karen A | $65,000 |
Source: Public Records
Tax History
| Year | Tax Paid | Tax Assessment Tax Assessment Total Assessment is a certain percentage of the fair market value that is determined by local assessors to be the total taxable value of land and additions on the property. | Land | Improvement |
|---|---|---|---|---|
| 2025 | $12,118 | $416,300 | $140,900 | $275,400 |
| 2024 | $11,010 | $397,600 | $140,900 | $256,700 |
| 2023 | $10,680 | $397,600 | $140,900 | $256,700 |
| 2022 | $10,294 | $397,600 | $140,900 | $256,700 |
| 2021 | $9,988 | $397,600 | $140,900 | $256,700 |
| 2020 | $9,709 | $362,800 | $110,900 | $251,900 |
| 2019 | $9,198 | $331,100 | $115,300 | $215,800 |
| 2018 | $8,976 | $318,400 | $115,700 | $202,700 |
| 2017 | $8,785 | $311,100 | $115,700 | $195,400 |
| 2016 | $8,265 | $298,700 | $113,500 | $185,200 |
| 2015 | $3,975 | $291,200 | $123,200 | $168,000 |
| 2014 | $3,904 | $291,200 | $123,200 | $168,000 |
| 2013 | -- | $287,900 | $123,200 | $164,700 |
| 2012 | -- | $289,400 | $129,800 | $159,600 |
Source: Public Records
Map
Nearby Homes
- 289 South St
- 40 Nivelle St
- 33 Joffre St
- 0 South St Unit 4969509
- 335 S Main St
- 47 Noyes St
- 273-279 S Main St
- 5 Holly Cir
- 5 Windchime Dr
- 30 Longmeadow Dr
- 47 South St
- 58 S State St
- 111 -113 South Main St
- 7-9 Myrtle St
- 25 N Spring St
- 4 Bow Center Rd Unit F2
- 26 Jonathan Ln
- 21 Fairfield Dr
- 22 Fairfield Dr
- 20 Fairfield Dr
Your Personal Tour Guide
Ask me questions while you tour the home.