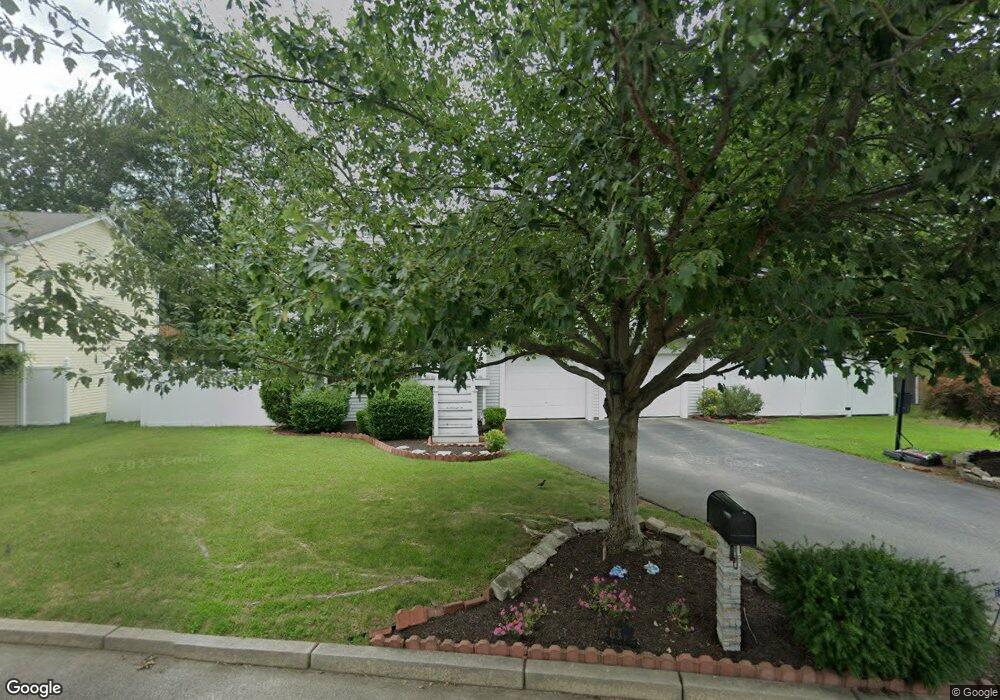
9 Mckay Ct Warwick, RI 02889
Long Meadow NeighborhoodEstimated Value: $457,000 - $475,000
3
Beds
1
Bath
1,138
Sq Ft
$411/Sq Ft
Est. Value
About This Home
This home is located at 9 Mckay Ct, Warwick, RI 02889 and is currently estimated at $468,082, approximately $411 per square foot. 9 Mckay Ct is a home located in Kent County with nearby schools including Saint Kevin School and Bishop Hendricken High School.
Ownership History
Date
Name
Owned For
Owner Type
Purchase Details
Closed on
Jan 9, 2026
Sold by
Mckenna Michael D and Mckenna Elizabeth T
Bought by
Alexander Dillin and Birney Clare
Current Estimated Value
Home Financials for this Owner
Home Financials are based on the most recent Mortgage that was taken out on this home.
Original Mortgage
$485,000
Outstanding Balance
$485,000
Interest Rate
6.23%
Mortgage Type
New Conventional
Estimated Equity
-$16,918
Purchase Details
Closed on
Mar 23, 2020
Sold by
Gilbert William and Mcandrew Philip
Bought by
Rodgers Timothy C and Rodgers Emma C
Home Financials for this Owner
Home Financials are based on the most recent Mortgage that was taken out on this home.
Original Mortgage
$229,500
Interest Rate
3.4%
Mortgage Type
New Conventional
Purchase Details
Closed on
Sep 7, 2018
Sold by
Medeiros Alison L
Bought by
Gilbert William and Mcandrew Philip
Purchase Details
Closed on
Feb 4, 2014
Sold by
Emerald Isle and Warwick City Of
Bought by
Medeiros Alison M
Purchase Details
Closed on
Jun 17, 2003
Sold by
Medeiros Dennis M
Bought by
Centerville Bldrs
Purchase Details
Closed on
Aug 18, 1992
Sold by
Morrison Gordon E
Bought by
Medeiros Dennis M
Home Financials for this Owner
Home Financials are based on the most recent Mortgage that was taken out on this home.
Original Mortgage
$110,028
Interest Rate
8.26%
Mortgage Type
Purchase Money Mortgage
Create a Home Valuation Report for This Property
The Home Valuation Report is an in-depth analysis detailing your home's value as well as a comparison with similar homes in the area
Home Values in the Area
Average Home Value in this Area
Purchase History
| Date | Buyer | Sale Price | Title Company |
|---|---|---|---|
| Alexander Dillin | $485,000 | -- | |
| Rodgers Timothy C | $275,000 | None Available | |
| Gilbert William | $138,000 | -- | |
| Medeiros Alison M | $4,507 | -- | |
| Centerville Bldrs | $110,000 | -- | |
| Medeiros Dennis M | $110,000 | -- | |
| Medeiros Dennis M | $110,000 | -- |
Source: Public Records
Mortgage History
| Date | Status | Borrower | Loan Amount |
|---|---|---|---|
| Open | Alexander Dillin | $485,000 | |
| Previous Owner | Rodgers Timothy C | $229,500 | |
| Previous Owner | Medeiros Dennis M | $75,000 | |
| Previous Owner | Medeiros Dennis M | $110,028 |
Source: Public Records
Tax History
| Year | Tax Paid | Tax Assessment Tax Assessment Total Assessment is a certain percentage of the fair market value that is determined by local assessors to be the total taxable value of land and additions on the property. | Land | Improvement |
|---|---|---|---|---|
| 2025 | $5,521 | $434,700 | $142,600 | $292,100 |
| 2024 | $4,764 | $329,200 | $124,000 | $205,200 |
| 2023 | $4,671 | $329,200 | $124,000 | $205,200 |
| 2022 | $4,218 | $225,200 | $79,800 | $145,400 |
| 2021 | $4,218 | $225,200 | $79,800 | $145,400 |
| 2020 | $4,218 | $225,200 | $79,800 | $145,400 |
| 2019 | $3,767 | $201,100 | $79,800 | $121,300 |
| 2018 | $3,099 | $153,100 | $74,100 | $79,000 |
| 2017 | $3,099 | $153,100 | $74,100 | $79,000 |
| 2016 | $3,099 | $153,100 | $74,100 | $79,000 |
| 2015 | $3,283 | $158,200 | $71,900 | $86,300 |
| 2014 | $3,173 | $158,200 | $71,900 | $86,300 |
| 2013 | $3,131 | $158,200 | $71,900 | $86,300 |
Source: Public Records
Map
Nearby Homes
- 46 Verndale St
- 355 Church Ave
- 103 Brightside Ave
- 101 Farmland Rd
- 2 Overbrook Ave
- 17 Ardway Ave
- 112 Old Warwick Ave
- 35 Transit St
- 39 Damon Ave
- 63 Ramblewood Dr
- 18 Sevilla Ave
- 37 Fulton St
- 266 Vineyard Rd
- 108 Fern St
- 0 Bethel St
- 54 Ansonia Rd
- 44 Woodstock Dr
- 31 Archdale Dr
- 11 Heights Ave
- 207 Stillwater Dr
Your Personal Tour Guide
Ask me questions while you tour the home.