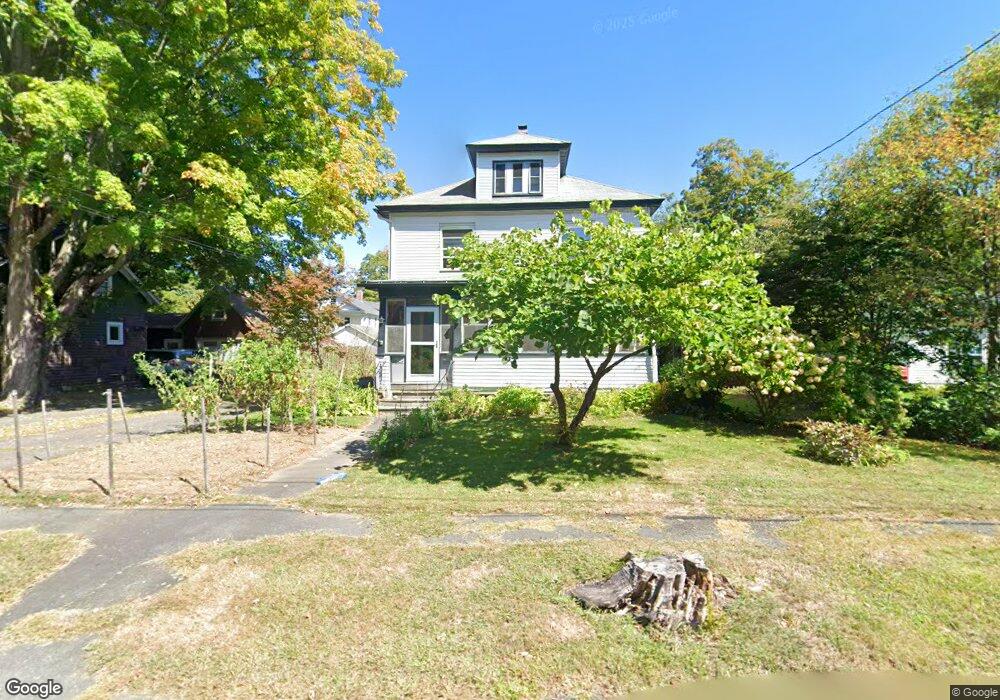
9 Mckinley Ave Easthampton, MA 01027
Estimated Value: $482,362 - $577,000
4
Beds
3
Baths
1,778
Sq Ft
$302/Sq Ft
Est. Value
About This Home
This home is located at 9 Mckinley Ave, Easthampton, MA 01027 and is currently estimated at $537,341, approximately $302 per square foot. 9 Mckinley Ave is a home located in Hampshire County with nearby schools including Easthampton High School, Hilltown Cooperative Charter Public School, and Calvary Baptist Christian School.
Ownership History
Date
Name
Owned For
Owner Type
Purchase Details
Closed on
Aug 3, 2021
Sold by
Ross William L and Leblanc-Ross Andree M
Bought by
Leblanc-Ross Andree M
Current Estimated Value
Purchase Details
Closed on
Sep 19, 1997
Sold by
Est Slattery Edward W and Slattery Francis M
Bought by
Leblanc-Ross Andree M and Ross William L
Create a Home Valuation Report for This Property
The Home Valuation Report is an in-depth analysis detailing your home's value as well as a comparison with similar homes in the area
Home Values in the Area
Average Home Value in this Area
Purchase History
We collect this data history from publicly available records. To have your information removed, we recommend requesting removal directly through your county’s website.
| Date | Buyer | Sale Price | Title Company |
|---|---|---|---|
| Leblanc-Ross Andree M | -- | None Available | |
| Leblanc-Ross Andree M | $114,265 | -- |
Source: Public Records
Mortgage History
We collect this data history from publicly available records. To have your information removed, we recommend requesting removal directly through your county’s website.
| Date | Status | Borrower | Loan Amount |
|---|---|---|---|
| Previous Owner | Leblanc-Ross Andree M | $16,200 | |
| Previous Owner | Leblanc-Ross Andree M | $178,000 |
Source: Public Records
Tax History
| Year | Tax Paid | Tax Assessment Tax Assessment Total Assessment is a certain percentage of the fair market value that is determined by local assessors to be the total taxable value of land and additions on the property. | Land | Improvement |
|---|---|---|---|---|
| 2025 | $5,620 | $411,100 | $104,900 | $306,200 |
| 2024 | $5,429 | $400,400 | $101,900 | $298,500 |
| 2023 | $4,073 | $278,000 | $80,400 | $197,600 |
| 2022 | $4,595 | $278,000 | $80,400 | $197,600 |
| 2021 | $5,046 | $287,700 | $80,400 | $207,300 |
| 2020 | $4,937 | $278,000 | $80,400 | $197,600 |
| 2019 | $4,029 | $260,600 | $80,400 | $180,200 |
| 2018 | $3,878 | $242,400 | $75,800 | $166,600 |
| 2017 | $3,788 | $233,700 | $72,900 | $160,800 |
| 2016 | $3,612 | $231,700 | $72,900 | $158,800 |
| 2015 | $3,510 | $231,700 | $72,900 | $158,800 |
Source: Public Records
Map
Nearby Homes
- M143 &152 Glendale St
- 359 Main St Unit 1B
- 20 Meadowbrook Dr
- 10 Robin Rd
- 28 Winter St Unit 28
- 138 West St
- 85 Garfield Ave
- 17 Adams St
- 64-66 Pleasant St
- 27 Holyoke St
- 16 Steplar Crossing Unit 16
- 52-54 Holyoke St
- 26 Mount Tom Ave
- 52 Knipfer Ave
- 36 & 36R Holly Cir
- 17 Olympia St
- 6 Pine Wood Dr
- 123 Holyoke St
- 0 Glendale Rd
- 25 Ballard St
Your Personal Tour Guide
Ask me questions while you tour the home.