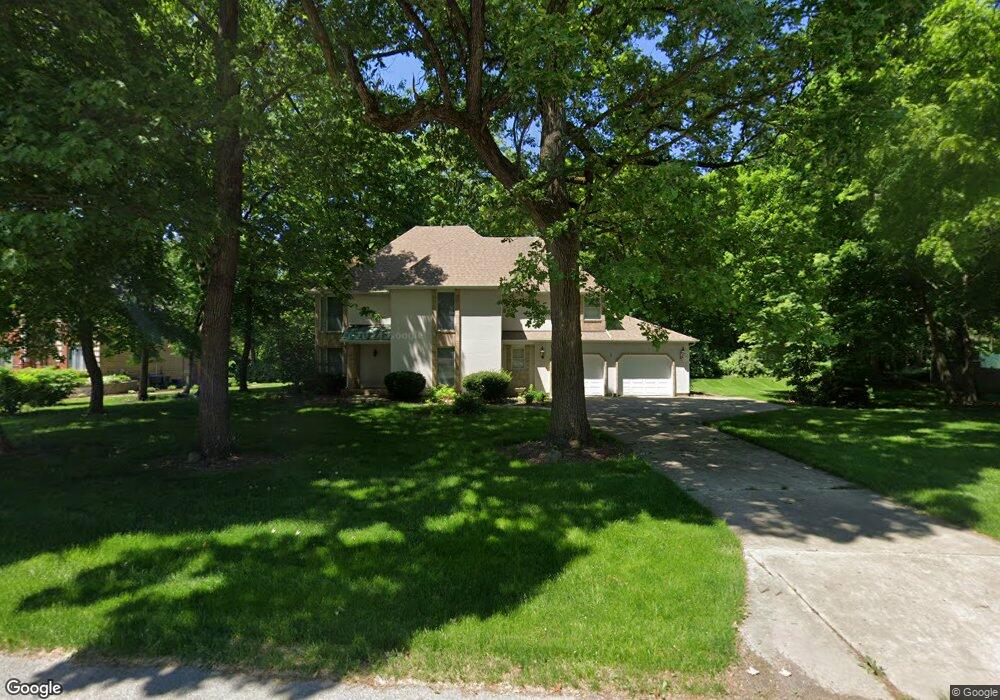
9 Morgan Creek Ct Oswego, IL 60543
South Oswego NeighborhoodEstimated Value: $564,000 - $604,000
4
Beds
3
Baths
2,698
Sq Ft
$218/Sq Ft
Est. Value
About This Home
This home is located at 9 Morgan Creek Ct, Oswego, IL 60543 and is currently estimated at $586,942, approximately $217 per square foot. 9 Morgan Creek Ct is a home located in Kendall County with nearby schools including Hunt Club Elementary School, Traughber Junior High School, and Oswego High School.
Ownership History
Date
Name
Owned For
Owner Type
Purchase Details
Closed on
Feb 26, 2021
Sold by
Snyder Steven R and Snyder Sandra C
Bought by
Declaration Of Trust and Snyder
Current Estimated Value
Home Financials for this Owner
Home Financials are based on the most recent Mortgage that was taken out on this home.
Original Mortgage
$306,000
Interest Rate
2.2%
Mortgage Type
New Conventional
Purchase Details
Closed on
Aug 27, 2001
Sold by
Snyder Sandra C
Bought by
Snyder Steven R and Snyder Sandra C
Home Financials for this Owner
Home Financials are based on the most recent Mortgage that was taken out on this home.
Original Mortgage
$195,000
Interest Rate
6.99%
Purchase Details
Closed on
Jan 7, 1997
Sold by
Snyder Steven R and Snyder Sandra C
Bought by
Snyder Sandra C
Purchase Details
Closed on
Mar 1, 1987
Create a Home Valuation Report for This Property
The Home Valuation Report is an in-depth analysis detailing your home's value as well as a comparison with similar homes in the area
Home Values in the Area
Average Home Value in this Area
Purchase History
| Date | Buyer | Sale Price | Title Company |
|---|---|---|---|
| Declaration Of Trust | -- | None Listed On Document | |
| Snyder Steven R | -- | Indecomm Global Services | |
| Snyder Steven R | -- | -- | |
| Snyder Sandra C | -- | -- | |
| -- | $44,900 | -- |
Source: Public Records
Mortgage History
| Date | Status | Borrower | Loan Amount |
|---|---|---|---|
| Previous Owner | Snyder Steven R | $306,000 | |
| Previous Owner | Snyder Steven R | $195,000 |
Source: Public Records
Tax History Compared to Growth
Tax History
| Year | Tax Paid | Tax Assessment Tax Assessment Total Assessment is a certain percentage of the fair market value that is determined by local assessors to be the total taxable value of land and additions on the property. | Land | Improvement |
|---|---|---|---|---|
| 2024 | $12,645 | $170,746 | $51,525 | $119,221 |
| 2023 | $11,338 | $151,102 | $45,597 | $105,505 |
| 2022 | $11,338 | $138,626 | $41,832 | $96,794 |
| 2021 | $11,625 | $137,254 | $41,418 | $95,836 |
| 2020 | $11,740 | $137,254 | $41,418 | $95,836 |
| 2019 | $12,401 | $137,254 | $41,418 | $95,836 |
| 2018 | $12,074 | $129,619 | $39,114 | $90,505 |
| 2017 | $11,980 | $124,634 | $37,610 | $87,024 |
| 2016 | $11,491 | $118,136 | $35,649 | $82,487 |
| 2015 | $11,688 | $114,695 | $34,611 | $80,084 |
| 2014 | -- | $110,284 | $33,280 | $77,004 |
| 2013 | -- | $107,072 | $32,311 | $74,761 |
Source: Public Records
Map
Nearby Homes
- 51 Chippewa Dr
- 4713 Cherry Rd
- 53 Abbeyfeale Dr
- 609 Chestnut Dr
- 406 Windsor Dr
- 7267 Roberts Ct
- 676 Cumberland Ln
- 7335 Roberts Dr
- 5837 Whitetail Ridge Dr
- 673 Cumberland Ln
- 5893 Whitetail Ridge Dr
- 668 Cumberland Ln
- 770 Dartmouth Ln
- 4700 Laughton Ave
- 851 Claridge Dr
- 315 White Pines Ln
- 100 acres Cherry Rd
- 318 Monica Ln
- 2489 Semillon St
- 2486 Semillon St
- 15 Morgan Creek Ct
- 8 Morgan Creek Ct
- 8 Crestview Dr
- 10 Crestview Dr
- 12 Morgan Creek Ct
- 4 Crestview Dr
- 17 Morgan Creek Ct
- 16 Morgan Creek Ct
- 14 Crestview Dr
- 80 Crestview Dr
- 84 Crestview Dr
- 76 Crestview Dr
- 18 Crestview Dr
- 7 Crestview Dr
- 11 Crestview Dr
- 15 Crestview Dr
- 3 Crestview Dr
- 72 Crestview Dr
- 22 Crestview Dr
- 19 Crestview Dr