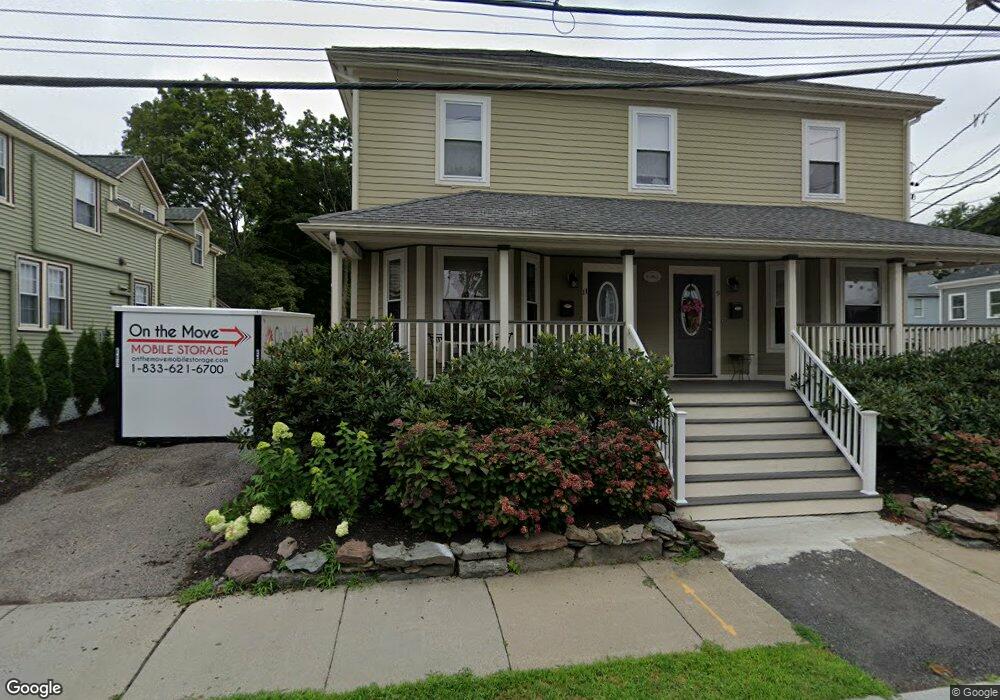
9 Prospect St Unit 11 West Newton, MA 02465
West Newton NeighborhoodEstimated Value: $725,000 - $896,000
2
Beds
2
Baths
1,343
Sq Ft
$596/Sq Ft
Est. Value
About This Home
This home is located at 9 Prospect St Unit 11, West Newton, MA 02465 and is currently estimated at $799,785, approximately $595 per square foot. 9 Prospect St Unit 11 is a home located in Middlesex County with nearby schools including Peirce Elementary School, Williams Elementary School, and F.A. Day Middle School.
Ownership History
Date
Name
Owned For
Owner Type
Purchase Details
Closed on
Nov 25, 2009
Sold by
Myrtle Bapt Chrch Of W
Bought by
Anderson Charlotte G
Current Estimated Value
Home Financials for this Owner
Home Financials are based on the most recent Mortgage that was taken out on this home.
Original Mortgage
$342,000
Outstanding Balance
$223,301
Interest Rate
4.92%
Mortgage Type
Purchase Money Mortgage
Estimated Equity
$576,484
Purchase Details
Closed on
Dec 15, 2006
Sold by
Evans Julia E
Bought by
Myrtle Bapt Chrch Newt
Home Financials for this Owner
Home Financials are based on the most recent Mortgage that was taken out on this home.
Original Mortgage
$700,000
Interest Rate
6.31%
Mortgage Type
Purchase Money Mortgage
Create a Home Valuation Report for This Property
The Home Valuation Report is an in-depth analysis detailing your home's value as well as a comparison with similar homes in the area
Home Values in the Area
Average Home Value in this Area
Purchase History
| Date | Buyer | Sale Price | Title Company |
|---|---|---|---|
| Anderson Charlotte G | $360,000 | -- | |
| Anderson Charlotte G | $360,000 | -- | |
| Myrtle Bapt Chrch Newt | $455,000 | -- | |
| Myrtle Bapt Chrch Newt | $455,000 | -- |
Source: Public Records
Mortgage History
| Date | Status | Borrower | Loan Amount |
|---|---|---|---|
| Open | Anderson Charlotte G | $342,000 | |
| Closed | Myrtle Bapt Chrch Newt | $342,000 | |
| Previous Owner | Myrtle Bapt Chrch Newt | $700,000 |
Source: Public Records
Tax History Compared to Growth
Tax History
| Year | Tax Paid | Tax Assessment Tax Assessment Total Assessment is a certain percentage of the fair market value that is determined by local assessors to be the total taxable value of land and additions on the property. | Land | Improvement |
|---|---|---|---|---|
| 2025 | $5,503 | $561,500 | $0 | $561,500 |
| 2024 | $5,320 | $545,100 | $0 | $545,100 |
| 2023 | $5,168 | $507,700 | $0 | $507,700 |
| 2022 | $5,086 | $483,500 | $0 | $483,500 |
| 2021 | $4,908 | $456,100 | $0 | $456,100 |
| 2020 | $4,762 | $456,100 | $0 | $456,100 |
| 2019 | $4,627 | $442,800 | $0 | $442,800 |
| 2018 | $5,482 | $426,500 | $0 | $426,500 |
| 2017 | $4,475 | $402,400 | $0 | $402,400 |
| 2016 | $4,280 | $376,100 | $0 | $376,100 |
| 2015 | $4,159 | $358,200 | $0 | $358,200 |
Source: Public Records
Map
Nearby Homes
- 0 Duncan Rd Unit 72925240
- 1488 Washington St Unit 1488
- 51 Bourne St
- 10 Crescent St Unit 2
- 17 Gilbert St
- 17 Crescent St
- 13 Weir St
- 1639 Washington St
- 62-64 Rowe St Unit B
- 66 Webster St
- 429 Cherry St Unit 11
- 228 Auburn St Unit B
- 228 Auburn St Unit 230
- 179 Auburn St
- 12 Inis Cir
- 90 Auburndale Ave
- 194 Auburn St
- 371 Cherry St
- 2 Elm St Unit 6
- 2 Elm St Unit 8
- 13 Prospect St
- 13 Prospect St Unit C
- 8 Curve St
- 8 Curve St Unit 1
- 3 Prospect St 0 Curve St
- 3 Prospect St
- 3 Prospect St Unit A
- 17 Propect St Unit 17
- 10 Prospect St Unit 12
- 10 Prospect St Unit 10
- 14 Prospect St Unit 18
- 12 Curve St
- 23 Prospect St
- 17 Prospect St
- 17 Prospect St Unit 17 17
- 17 Prospect St Unit 17
- 9 Curve St
- 19 Prospect St
- 11 Curve St
- 15 Prospect St