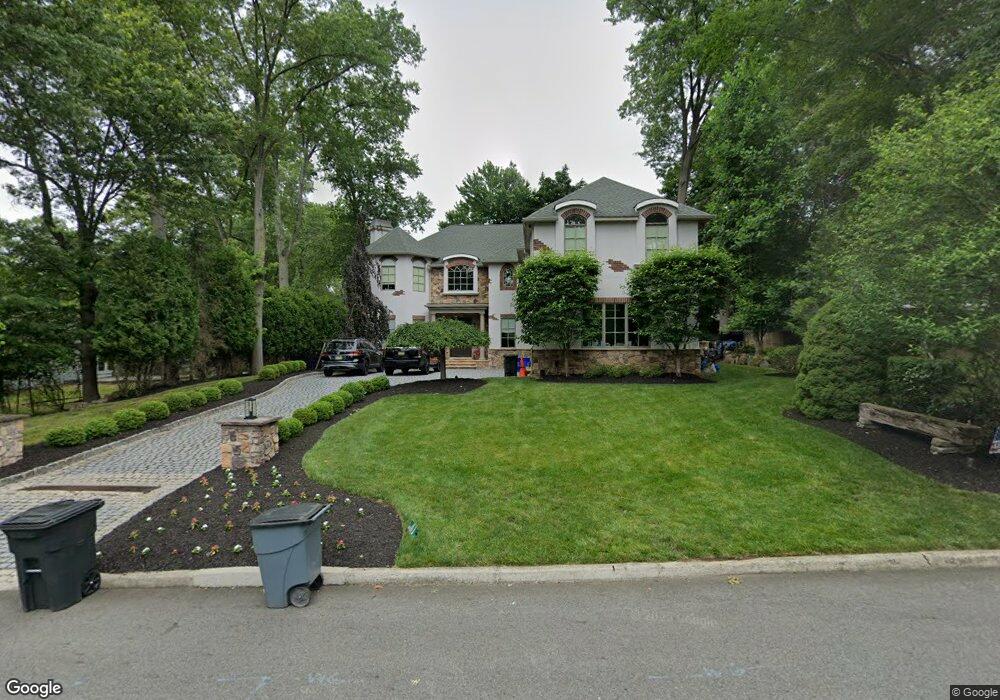
9 Ranch Ln Closter, NJ 07624
Estimated Value: $2,321,000 - $3,048,000
6
Beds
7
Baths
4,797
Sq Ft
$534/Sq Ft
Est. Value
About This Home
This home is located at 9 Ranch Ln, Closter, NJ 07624 and is currently estimated at $2,559,919, approximately $533 per square foot. 9 Ranch Ln is a home located in Bergen County with nearby schools including Hillside Elementary School, Tenakill Middle School, and Northern Valley Regional High School at Demarest.
Ownership History
Date
Name
Owned For
Owner Type
Purchase Details
Closed on
Jun 29, 2015
Sold by
Allen Terrence and Allen Janet
Bought by
Fries Gavin and Fries Lindsay
Current Estimated Value
Home Financials for this Owner
Home Financials are based on the most recent Mortgage that was taken out on this home.
Original Mortgage
$950,000
Outstanding Balance
$741,013
Interest Rate
3.87%
Mortgage Type
New Conventional
Estimated Equity
$1,818,906
Purchase Details
Closed on
Oct 23, 2008
Sold by
Allen Terrence and Allen Janet
Bought by
Allen Terrence and Allen Janet
Purchase Details
Closed on
Jul 18, 2005
Sold by
Wells Leon
Bought by
Allen Terrence and Allen Janet
Home Financials for this Owner
Home Financials are based on the most recent Mortgage that was taken out on this home.
Original Mortgage
$608,000
Interest Rate
5.54%
Create a Home Valuation Report for This Property
The Home Valuation Report is an in-depth analysis detailing your home's value as well as a comparison with similar homes in the area
Home Values in the Area
Average Home Value in this Area
Purchase History
| Date | Buyer | Sale Price | Title Company |
|---|---|---|---|
| Fries Gavin | $1,575,000 | None Available | |
| Allen Terrence | -- | -- | |
| Allen Terrence | $870,000 | -- |
Source: Public Records
Mortgage History
| Date | Status | Borrower | Loan Amount |
|---|---|---|---|
| Open | Fries Gavin | $950,000 | |
| Previous Owner | Allen Terrence | $608,000 |
Source: Public Records
Tax History
| Year | Tax Paid | Tax Assessment Tax Assessment Total Assessment is a certain percentage of the fair market value that is determined by local assessors to be the total taxable value of land and additions on the property. | Land | Improvement |
|---|---|---|---|---|
| 2025 | $35,604 | $1,819,900 | $571,300 | $1,248,600 |
| 2024 | $34,861 | $1,682,600 | $512,500 | $1,170,100 |
| 2023 | $34,299 | $1,626,000 | $479,500 | $1,146,500 |
| 2022 | $34,299 | $1,550,600 | $459,500 | $1,091,100 |
| 2021 | $34,809 | $1,510,800 | $452,000 | $1,058,800 |
| 2020 | $34,115 | $1,522,300 | $455,500 | $1,066,800 |
| 2019 | $33,399 | $1,506,500 | $448,500 | $1,058,000 |
| 2018 | $33,020 | $1,483,400 | $441,500 | $1,041,900 |
| 2017 | $34,951 | $1,531,600 | $421,300 | $1,110,300 |
| 2016 | $34,293 | $1,531,600 | $421,300 | $1,110,300 |
| 2015 | $33,542 | $972,100 | $421,300 | $550,800 |
| 2014 | $32,423 | $1,522,900 | $421,300 | $1,101,600 |
Source: Public Records
Map
Nearby Homes
- 8 Ranch Ln
- 520 Homans Ave
- 22 Maplewood Rd
- 14 O Shaughnessy Ln
- 91 Macarthur Ave
- 379 Anderson Ave
- 353 Homans Ave
- 12 Cambridge Way
- 56 Arnold Ave
- 16 Poplar Rd
- 543 Closter Dock Rd
- 32 Litchfield Way
- 28 Buckingham Dr
- 114 Bellaire Dr
- 311 Bellaire Dr
- 34 Cambridge Way
- 38 Cambridge Way
- 31 Collins Ave
- 8 Church Ct
- 1 Stone Bridge Ct
Your Personal Tour Guide
Ask me questions while you tour the home.