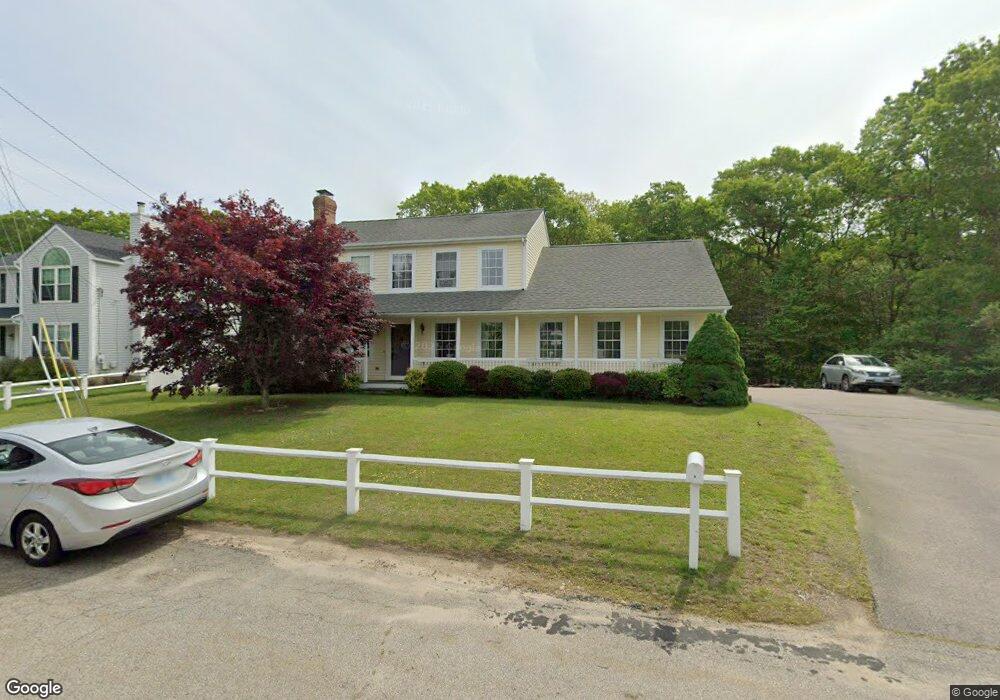
9 Red Brook Dr Westerly, RI 02891
Estimated Value: $606,655 - $1,087,000
3
Beds
3
Baths
1,664
Sq Ft
$470/Sq Ft
Est. Value
About This Home
This home is located at 9 Red Brook Dr, Westerly, RI 02891 and is currently estimated at $782,414, approximately $470 per square foot. 9 Red Brook Dr is a home located in Washington County with nearby schools including Westerly High School and St. Michael School.
Ownership History
Date
Name
Owned For
Owner Type
Purchase Details
Closed on
Dec 8, 1998
Sold by
Nema Enterprises Inc
Bought by
Imhof Patrick V and Imhof Lisa A
Current Estimated Value
Home Financials for this Owner
Home Financials are based on the most recent Mortgage that was taken out on this home.
Original Mortgage
$152,500
Interest Rate
6.68%
Create a Home Valuation Report for This Property
The Home Valuation Report is an in-depth analysis detailing your home's value as well as a comparison with similar homes in the area
Home Values in the Area
Average Home Value in this Area
Purchase History
| Date | Buyer | Sale Price | Title Company |
|---|---|---|---|
| Imhof Patrick V | $170,000 | -- |
Source: Public Records
Mortgage History
| Date | Status | Borrower | Loan Amount |
|---|---|---|---|
| Closed | Imhof Patrick V | $85,385 | |
| Closed | Imhof Patrick V | $97,000 | |
| Closed | Imhof Patrick V | $123,500 | |
| Closed | Imhof Patrick V | $152,500 |
Source: Public Records
Tax History
| Year | Tax Paid | Tax Assessment Tax Assessment Total Assessment is a certain percentage of the fair market value that is determined by local assessors to be the total taxable value of land and additions on the property. | Land | Improvement |
|---|---|---|---|---|
| 2025 | $3,771 | $530,400 | $216,400 | $314,000 |
| 2024 | $3,850 | $392,500 | $146,800 | $245,700 |
| 2023 | $3,776 | $392,500 | $146,800 | $245,700 |
| 2022 | $3,752 | $392,500 | $146,800 | $245,700 |
| 2021 | $3,835 | $332,900 | $127,700 | $205,200 |
| 2020 | $3,765 | $332,900 | $127,700 | $205,200 |
| 2019 | $3,728 | $332,900 | $127,700 | $205,200 |
| 2018 | $3,405 | $286,600 | $117,900 | $168,700 |
| 2017 | $3,322 | $286,600 | $117,900 | $168,700 |
| 2016 | $3,347 | $286,600 | $117,900 | $168,700 |
| 2015 | $3,223 | $297,900 | $130,400 | $167,500 |
| 2014 | $3,170 | $297,900 | $130,400 | $167,500 |
Source: Public Records
Map
Nearby Homes
- 18 Timothy Dr
- 33 Whipple Ave
- 6 Wilder Ave
- 24 Abbey Ln Unit 13
- 23 Abbey Ln Unit 12
- 19 Crestview Dr Unit C
- 21 North Dr
- 7 Spring Pond Rd
- 8 Kettle Close
- 9 Compass Way Unit 101
- 1 Compass Way Unit A103
- 54 Sherwood Dr
- 174 River Rd
- 10 Tristam St
- 22 Summertime Cir
- 23 Summertime Cir
- 38 Summertime Cir
- 39 Summertime Cir
- 45 Summertime Cir
- 41 Summertime Cir Unit 41
Your Personal Tour Guide
Ask me questions while you tour the home.