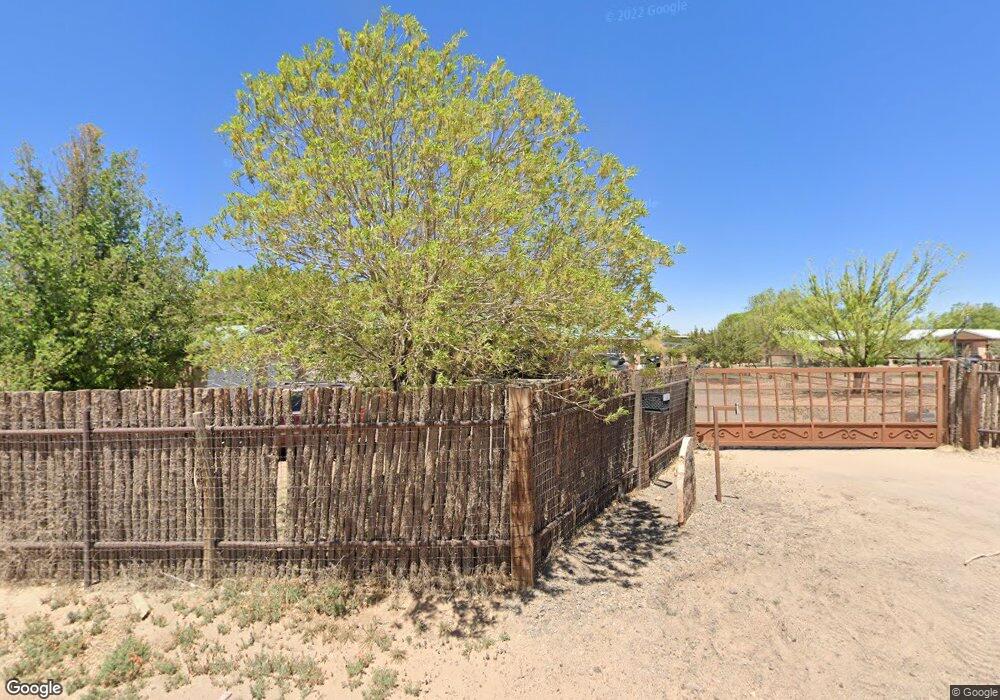
9 Ridgeline Rd Santa Fe, NM 87507
Southwest Santa Fe NeighborhoodEstimated Value: $253,286 - $534,000
3
Beds
2
Baths
1,905
Sq Ft
$207/Sq Ft
Est. Value
About This Home
This home is located at 9 Ridgeline Rd, Santa Fe, NM 87507 and is currently estimated at $393,572, approximately $206 per square foot. 9 Ridgeline Rd is a home located in Santa Fe County with nearby schools including Pinon Elementary School, Milagro Middle School, and Capital High School.
Ownership History
Date
Name
Owned For
Owner Type
Purchase Details
Closed on
Nov 15, 2021
Sold by
Farrald and Eloise
Bought by
Dominguez Juan G and Dominguez Adriana
Current Estimated Value
Purchase Details
Closed on
Apr 29, 2004
Sold by
Fairbanks Capital Corp
Bought by
Dominguez Juan G and Dominguez Adriana
Home Financials for this Owner
Home Financials are based on the most recent Mortgage that was taken out on this home.
Original Mortgage
$112,520
Interest Rate
5.81%
Mortgage Type
Unknown
Purchase Details
Closed on
Nov 25, 2003
Sold by
Peinado Sam S
Bought by
Fairbanks Capital Corp
Purchase Details
Closed on
Oct 4, 2002
Sold by
National City Home Loan Services Inc
Bought by
Peinado Sam S
Home Financials for this Owner
Home Financials are based on the most recent Mortgage that was taken out on this home.
Original Mortgage
$104,000
Interest Rate
6.01%
Create a Home Valuation Report for This Property
The Home Valuation Report is an in-depth analysis detailing your home's value as well as a comparison with similar homes in the area
Home Values in the Area
Average Home Value in this Area
Purchase History
| Date | Buyer | Sale Price | Title Company |
|---|---|---|---|
| Dominguez Juan G | -- | None Listed On Document | |
| Dominguez Juan G | -- | First American Title Ins Co | |
| Fairbanks Capital Corp | -- | -- | |
| Peinado Sam S | -- | -- |
Source: Public Records
Mortgage History
| Date | Status | Borrower | Loan Amount |
|---|---|---|---|
| Previous Owner | Dominguez Juan G | $112,520 | |
| Previous Owner | Peinado Sam S | $104,000 | |
| Closed | Peinado Sam S | $26,000 |
Source: Public Records
Tax History
| Year | Tax Paid | Tax Assessment Tax Assessment Total Assessment is a certain percentage of the fair market value that is determined by local assessors to be the total taxable value of land and additions on the property. | Land | Improvement |
|---|---|---|---|---|
| 2025 | $1,603 | $211,117 | $83,227 | $127,890 |
| 2024 | $1,562 | $204,969 | $80,803 | $124,166 |
| 2023 | $1,562 | $199,000 | $78,450 | $120,550 |
| 2022 | $1,527 | $193,205 | $91,485 | $101,720 |
| 2021 | $1,504 | $62,526 | $29,606 | $32,920 |
| 2020 | $1,459 | $60,706 | $27,786 | $32,920 |
| 2019 | $1,438 | $58,938 | $25,074 | $33,864 |
| 2018 | $1,407 | $57,222 | $24,344 | $32,878 |
| 2017 | $1,371 | $55,556 | $23,635 | $31,921 |
| 2016 | $1,143 | $47,679 | $22,947 | $24,732 |
| 2015 | $1,116 | $46,291 | $22,279 | $24,012 |
| 2014 | $1,050 | $44,897 | $21,608 | $23,289 |
Source: Public Records
Map
Nearby Homes
- 4748 Vista Del Sol
- 6751 Camino Carlita
- 4715 Sambra Dr
- 6356 Jaguar Dr
- 6389 Jaguar Dr
- 4615 Sunset Ridge
- 6939 Golden Mesa
- 6346 Avenida Chamisa
- 6348 Avenida Chamisa
- 4067 Fairly
- 6985 Golden Mesa
- 7000 Camino Rojo
- 6524 Valentine Way
- 27 Firecrown Ln
- 4532 Camino Verde
- 7223 Via Verde
- 4725 Sundial Way
- 32 Wirecrest Ln
- 4460 Calle Turquesa
- 4609 Contenta Ridge
- 11 Ridgeline Rd
- 1 Rayon Dr
- 71 Mutt Nelson Rd
- 2 Ridgeline Rd
- 59 Mutt Nelson Rd
- 3 Rayon Dr
- 1 Paseo Margarita
- 73 Mutt Nelson Rd
- 5 Rayon Dr Unit A
- 7 Rayon Dr
- 75 Mutt Nelson Rd
- 24 Ridgeline Rd
- 3 Paseo Margarita
- 3 Paseo Margarita
- 5 Paseo Margarita
- 9 Rayon Dr
- 27 Ridgeline Rd
- 11 Paseo Margarita
- 53 Mutt Nelson Rd
- 13 Paseo Margarita
Your Personal Tour Guide
Ask me questions while you tour the home.