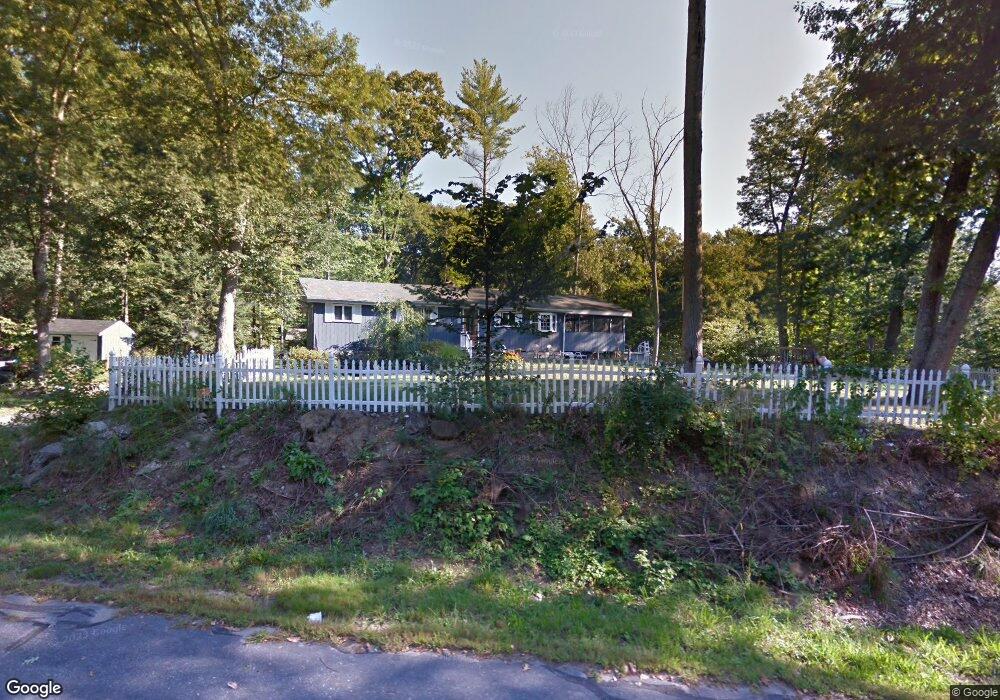
9 Robin Hood Rd Windham, NH 03087
Estimated Value: $559,260 - $742,000
3
Beds
2
Baths
1,372
Sq Ft
$463/Sq Ft
Est. Value
About This Home
This home is located at 9 Robin Hood Rd, Windham, NH 03087 and is currently estimated at $635,315, approximately $463 per square foot. 9 Robin Hood Rd is a home located in Rockingham County with nearby schools including Golden Brook Elementary School, Windham Middle School, and Windham High School.
Ownership History
Date
Name
Owned For
Owner Type
Purchase Details
Closed on
Jan 23, 2024
Sold by
Paradise Stacy A
Bought by
Paradise Michael
Current Estimated Value
Purchase Details
Closed on
Sep 3, 2002
Sold by
Kagan Sholly
Bought by
Paradise Michael and Paradise Stacy A
Home Financials for this Owner
Home Financials are based on the most recent Mortgage that was taken out on this home.
Original Mortgage
$92,000
Interest Rate
6.55%
Create a Home Valuation Report for This Property
The Home Valuation Report is an in-depth analysis detailing your home's value as well as a comparison with similar homes in the area
Home Values in the Area
Average Home Value in this Area
Purchase History
| Date | Buyer | Sale Price | Title Company |
|---|---|---|---|
| Paradise Michael | -- | None Available | |
| Paradise Michael | -- | None Available | |
| Paradise Michael | $140,000 | -- | |
| Paradise Michael | $140,000 | -- |
Source: Public Records
Mortgage History
| Date | Status | Borrower | Loan Amount |
|---|---|---|---|
| Previous Owner | Paradise Michael | $92,000 |
Source: Public Records
Tax History Compared to Growth
Tax History
| Year | Tax Paid | Tax Assessment Tax Assessment Total Assessment is a certain percentage of the fair market value that is determined by local assessors to be the total taxable value of land and additions on the property. | Land | Improvement |
|---|---|---|---|---|
| 2024 | $8,159 | $360,400 | $173,400 | $187,000 |
| 2023 | $7,713 | $360,400 | $173,400 | $187,000 |
| 2022 | $7,118 | $360,200 | $173,400 | $186,800 |
| 2021 | $6,707 | $360,200 | $173,400 | $186,800 |
| 2020 | $6,891 | $360,200 | $173,400 | $186,800 |
| 2019 | $6,127 | $271,700 | $159,500 | $112,200 |
| 2018 | $6,328 | $271,700 | $159,500 | $112,200 |
| 2017 | $5,488 | $271,700 | $159,500 | $112,200 |
| 2016 | $5,928 | $271,700 | $159,500 | $112,200 |
| 2015 | $5,901 | $271,700 | $159,500 | $112,200 |
| 2014 | $5,321 | $221,700 | $146,000 | $75,700 |
| 2013 | $5,074 | $215,000 | $146,000 | $69,000 |
Source: Public Records
Map
Nearby Homes
- 24 Rolling Ridge Rd
- 6 Chadwick Cir
- 1 Squire Armour Rd
- 108 S Shore Rd
- 3 S Shore Rd
- 54 Enterprise Dr
- 25 Range Rd
- 174 N Policy St
- 15 Enterprise Dr
- 10 Roulston Rd
- 10 1st St
- 133 Brookdale Rd
- 70 Governor Dinsmore Rd
- 10 Harris Rd
- 17 Clinton St
- 63 Searles Rd
- 21 Lakeshore Rd
- 11 Sullivan Ct
- 6-18 Mary Anthony Dr
- 17 Cole Rd