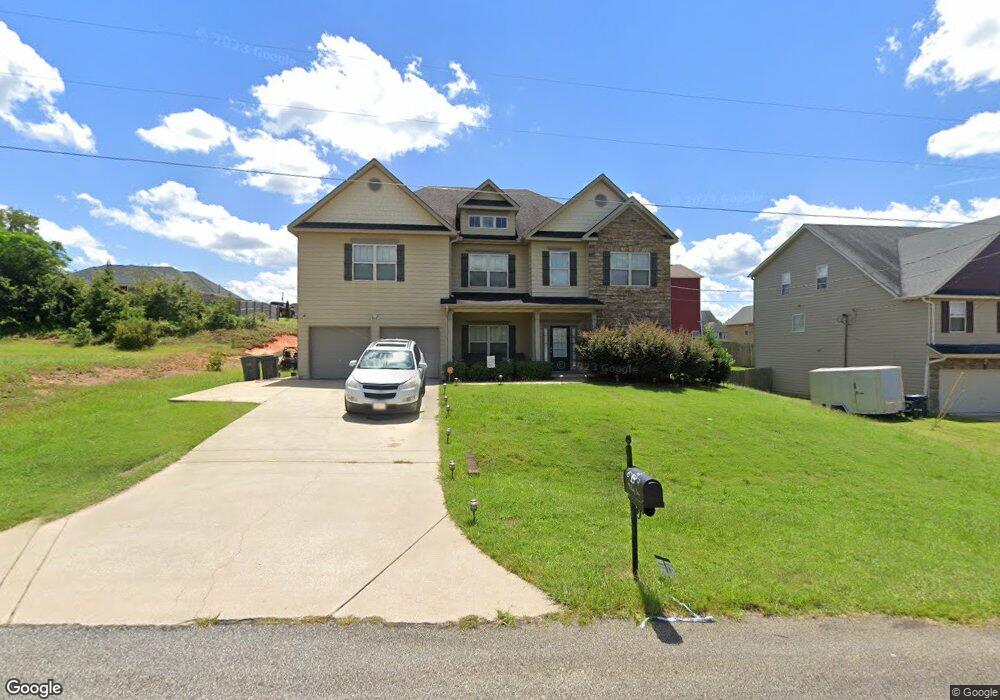
9 Rusty Dr Phenix City, GA 36869
Estimated Value: $340,853 - $424,000
--
Bed
4
Baths
4,192
Sq Ft
$90/Sq Ft
Est. Value
About This Home
This home is located at 9 Rusty Dr, Phenix City, GA 36869 and is currently estimated at $377,213, approximately $89 per square foot. 9 Rusty Dr is a home located in Russell County with nearby schools including Ridgecrest Elementary School, South Girard School, and Phenix City Intermediate School.
Ownership History
Date
Name
Owned For
Owner Type
Purchase Details
Closed on
Jul 27, 2012
Sold by
Legendary Communities Alabama Llc
Bought by
Gardner Devron M and Gardner Tanya A
Current Estimated Value
Home Financials for this Owner
Home Financials are based on the most recent Mortgage that was taken out on this home.
Original Mortgage
$214,412
Outstanding Balance
$148,604
Interest Rate
3.68%
Mortgage Type
New Conventional
Estimated Equity
$228,609
Purchase Details
Closed on
Aug 28, 2009
Sold by
Ridgebrook Llc
Bought by
Phenix City
Create a Home Valuation Report for This Property
The Home Valuation Report is an in-depth analysis detailing your home's value as well as a comparison with similar homes in the area
Home Values in the Area
Average Home Value in this Area
Purchase History
| Date | Buyer | Sale Price | Title Company |
|---|---|---|---|
| Gardner Devron M | $209,900 | -- | |
| Phenix City | -- | -- |
Source: Public Records
Mortgage History
| Date | Status | Borrower | Loan Amount |
|---|---|---|---|
| Open | Gardner Devron M | $214,412 |
Source: Public Records
Tax History Compared to Growth
Tax History
| Year | Tax Paid | Tax Assessment Tax Assessment Total Assessment is a certain percentage of the fair market value that is determined by local assessors to be the total taxable value of land and additions on the property. | Land | Improvement |
|---|---|---|---|---|
| 2024 | $1,965 | $34,550 | $2,500 | $32,050 |
| 2023 | $1,779 | $31,391 | $2,520 | $28,871 |
| 2022 | $3,621 | $61,375 | $4,200 | $57,175 |
| 2021 | $3,226 | $54,676 | $4,200 | $50,476 |
| 2020 | $2,675 | $45,340 | $4,200 | $41,140 |
| 2019 | $2,601 | $44,080 | $4,200 | $39,880 |
| 2018 | $2,627 | $44,520 | $4,200 | $40,320 |
| 2017 | $2,651 | $43,720 | $4,200 | $39,520 |
| 2016 | $2,629 | $44,560 | $4,200 | $40,360 |
| 2015 | $2,615 | $22,157 | $2,100 | $20,057 |
| 2014 | $2,663 | $22,571 | $2,100 | $20,471 |
Source: Public Records
Map
Nearby Homes