Estimated Value: $426,958 - $463,000
3
Beds
2
Baths
1,652
Sq Ft
$270/Sq Ft
Est. Value
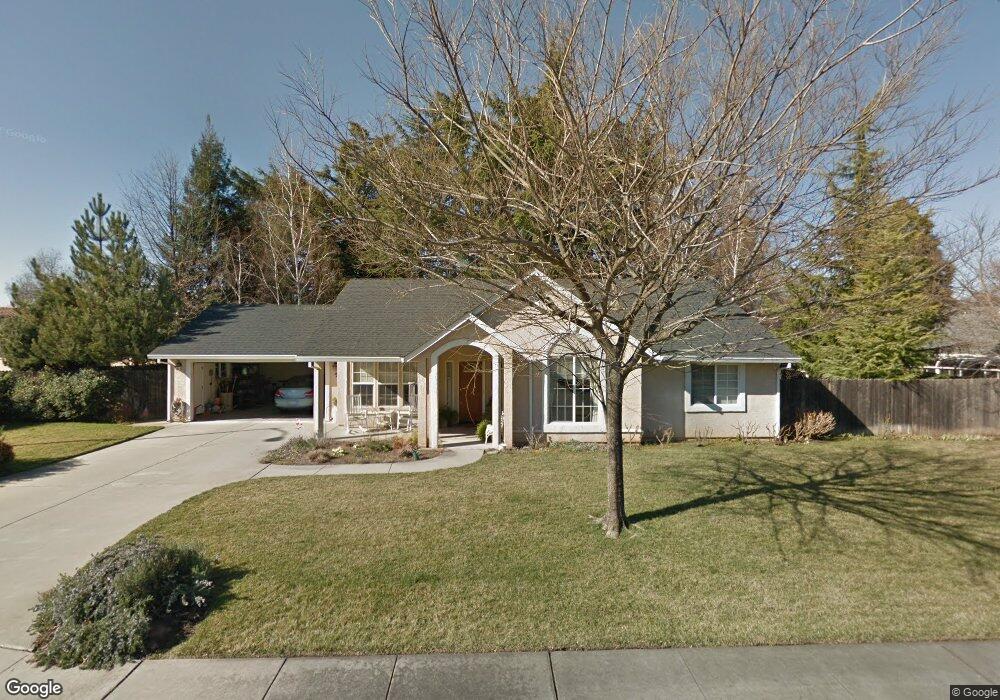
About This Home
This home is located at 9 Seabird Ln, Chico, CA 95926 and is currently estimated at $446,240, approximately $270 per square foot. 9 Seabird Ln is a home located in Butte County with nearby schools including Neal Dow Elementary School, Bidwell Junior High School, and Pleasant Valley High School.
Ownership History
Date
Name
Owned For
Owner Type
Purchase Details
Closed on
Sep 15, 2021
Sold by
Joiner Priscilla J and The Priscilla J Joiner Trust
Bought by
Joiner Priscilla J and The Priscilla J Joiner Trust
Current Estimated Value
Home Financials for this Owner
Home Financials are based on the most recent Mortgage that was taken out on this home.
Original Mortgage
$145,500
Outstanding Balance
$132,394
Interest Rate
2.8%
Mortgage Type
New Conventional
Estimated Equity
$313,846
Purchase Details
Closed on
Jun 12, 2018
Sold by
Joiner Priscilla J
Bought by
Joiner Priscilla J and The Priscilla J Joiner Tst
Purchase Details
Closed on
Apr 26, 1999
Sold by
Meghdadi Andrew and Meghdadi Annette J
Bought by
Joiner Priscilla J
Home Financials for this Owner
Home Financials are based on the most recent Mortgage that was taken out on this home.
Original Mortgage
$85,000
Interest Rate
6.98%
Create a Home Valuation Report for This Property
The Home Valuation Report is an in-depth analysis detailing your home's value as well as a comparison with similar homes in the area
Purchase History
| Date | Buyer | Sale Price | Title Company |
|---|---|---|---|
| Joiner Priscilla J | -- | Mid Valley Title & Escrow Co | |
| Joiner Priscilla J | -- | None Available | |
| Joiner Priscilla J | $160,000 | Mid Valley Title & Escrow Co |
Source: Public Records
Mortgage History
| Date | Status | Borrower | Loan Amount |
|---|---|---|---|
| Open | Joiner Priscilla J | $145,500 | |
| Closed | Joiner Priscilla J | $85,000 |
Source: Public Records
Tax History
| Year | Tax Paid | Tax Assessment Tax Assessment Total Assessment is a certain percentage of the fair market value that is determined by local assessors to be the total taxable value of land and additions on the property. | Land | Improvement |
|---|---|---|---|---|
| 2025 | $2,648 | $250,805 | $83,075 | $167,730 |
| 2024 | $2,648 | $245,889 | $81,447 | $164,442 |
| 2023 | $2,615 | $241,068 | $79,850 | $161,218 |
| 2022 | $2,571 | $236,342 | $78,285 | $158,057 |
| 2021 | $2,521 | $231,708 | $76,750 | $154,958 |
| 2020 | $2,513 | $229,334 | $75,964 | $153,370 |
| 2019 | $2,467 | $224,838 | $74,475 | $150,363 |
| 2018 | $2,420 | $220,430 | $73,015 | $147,415 |
| 2017 | $2,369 | $216,109 | $71,584 | $144,525 |
| 2016 | $2,161 | $211,873 | $70,181 | $141,692 |
| 2015 | $2,160 | $208,691 | $69,127 | $139,564 |
| 2014 | $2,106 | $204,604 | $67,773 | $136,831 |
Source: Public Records
Map
Nearby Homes
- 1094 Manzanita Ave
- 9 Trieste Way
- 2165 Ceres Ave
- 1612 Neal Dow Ave
- 75 Cottage Ave
- 5 Canterbury Cir
- 50 Casa Del Rey Ct
- 460 E 10th Ave
- 1280 Dale Way
- 467 E 8th Ave
- 1261 Parque Dr
- 1125 Sheridan Ave
- 1125 Sheridan Ave Unit 36
- 469 E 7th Ave
- 996 E 1st Ave
- 4 Lakewood Way
- 977 Sarah Ave
- 30 Plaza Way Unit 6
- 30 Plaza Way Unit 7
- 3 Sunflower Ct
- 14 Pelican Park Dr
- 8 Seabird Ln
- 15 Pelican Park Dr
- 2186 North Ave Unit 3
- 2186 North Ave
- 2 Seabird Ln
- 2190 North Ave
- 7 Seabird Ln
- 10 Pelican Park Dr
- 2182 North Ave Unit 2
- 2182 North Ave
- 16 Pelican Park Dr
- 14 Montclair Dr
- 6 Seabird Ln
- 12 Montclair Dr
- 2178 North Ave
- 4 Pelican Park Dr
- 5 Pelican Park Dr
- 3 Seabird Ln
- 10 Montclair Dr
Your Personal Tour Guide
Ask me questions while you tour the home.