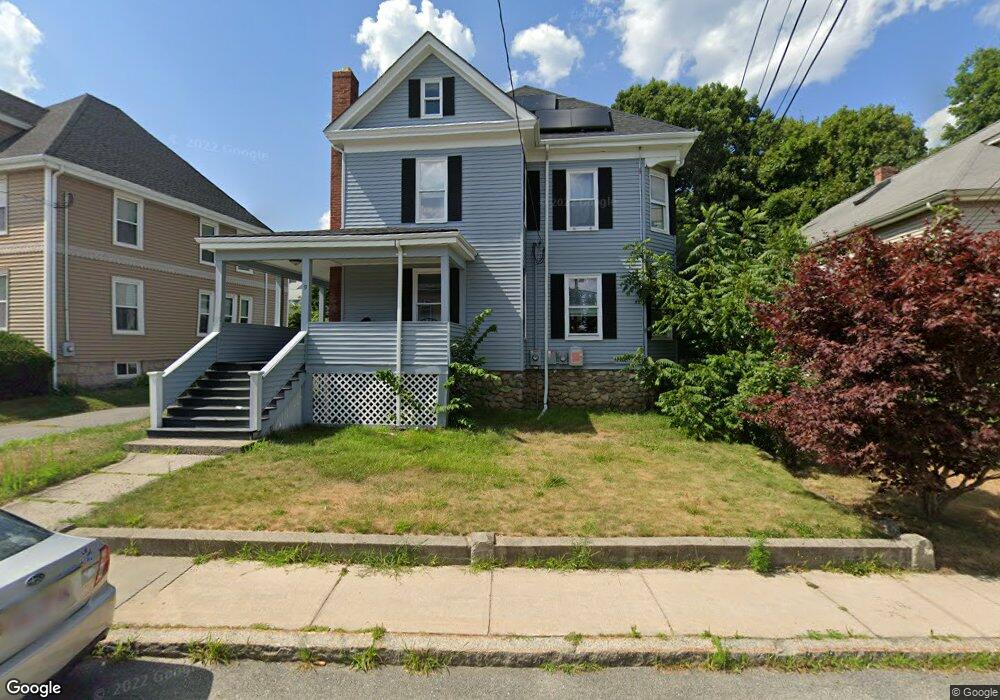
9 State St Milford, MA 01757
Estimated Value: $500,000 - $534,000
4
Beds
2
Baths
2,072
Sq Ft
$252/Sq Ft
Est. Value
About This Home
This home is located at 9 State St, Milford, MA 01757 and is currently estimated at $522,809, approximately $252 per square foot. 9 State St is a home located in Worcester County with nearby schools including Milford High School and Bethany Christian Academy.
Ownership History
Date
Name
Owned For
Owner Type
Purchase Details
Closed on
Jan 17, 2013
Sold by
Jones Myra L and Jones James S
Bought by
Jones Myra L
Current Estimated Value
Home Financials for this Owner
Home Financials are based on the most recent Mortgage that was taken out on this home.
Original Mortgage
$243,529
Outstanding Balance
$169,485
Interest Rate
3.39%
Mortgage Type
New Conventional
Estimated Equity
$353,324
Purchase Details
Closed on
Jun 1, 2009
Sold by
Fagan Anne M
Bought by
Reese Myra L
Home Financials for this Owner
Home Financials are based on the most recent Mortgage that was taken out on this home.
Original Mortgage
$251,289
Interest Rate
4.87%
Mortgage Type
VA
Purchase Details
Closed on
Mar 14, 1994
Sold by
Dweck Richard D and Dweck Shelley
Bought by
Fagan Anne M
Purchase Details
Closed on
Apr 1, 1988
Sold by
Moran Gary L
Bought by
Dweck Richard D
Create a Home Valuation Report for This Property
The Home Valuation Report is an in-depth analysis detailing your home's value as well as a comparison with similar homes in the area
Home Values in the Area
Average Home Value in this Area
Purchase History
| Date | Buyer | Sale Price | Title Company |
|---|---|---|---|
| Jones Myra L | -- | -- | |
| Reese Myra L | $246,000 | -- | |
| Fagan Anne M | $130,900 | -- | |
| Dweck Richard D | $151,500 | -- |
Source: Public Records
Mortgage History
| Date | Status | Borrower | Loan Amount |
|---|---|---|---|
| Open | Dweck Richard D | $243,529 | |
| Previous Owner | Reese Myra L | $251,289 | |
| Previous Owner | Dweck Richard D | $148,500 |
Source: Public Records
Tax History
| Year | Tax Paid | Tax Assessment Tax Assessment Total Assessment is a certain percentage of the fair market value that is determined by local assessors to be the total taxable value of land and additions on the property. | Land | Improvement |
|---|---|---|---|---|
| 2025 | $5,783 | $451,800 | $150,700 | $301,100 |
| 2024 | $5,554 | $417,900 | $143,600 | $274,300 |
| 2023 | $5,478 | $379,100 | $120,900 | $258,200 |
| 2022 | $5,225 | $339,500 | $110,400 | $229,100 |
| 2021 | $4,697 | $293,900 | $110,400 | $183,500 |
| 2020 | $4,640 | $290,700 | $110,400 | $180,300 |
| 2019 | $11,248 | $252,300 | $110,400 | $141,900 |
| 2018 | $4,090 | $247,000 | $105,100 | $141,900 |
| 2017 | $10,664 | $229,000 | $105,100 | $123,900 |
| 2016 | $3,616 | $210,500 | $94,600 | $115,900 |
| 2015 | $3,633 | $207,000 | $91,100 | $115,900 |
Source: Public Records
Map
Nearby Homes
- 4-6 State St
- 9 Granite St
- 67 Pine St
- 14 Emmons St
- 1 E Main St
- 56 S Bow St
- 47 W Walnut St
- 6 Jen Paul Way Unit B
- 6 Poplar St
- 99-101 E Main St
- 33 Chestnut St
- 14 Lawrence St
- 3 Columbus Ave
- 40 Chestnut St
- 9 Packard Rd
- 56 S Main St
- 2 Lee St Unit B
- 59 Lawrence St
- 35 Woodland Ave Unit 35A
- 9 Ariana Cir Unit 9
Your Personal Tour Guide
Ask me questions while you tour the home.