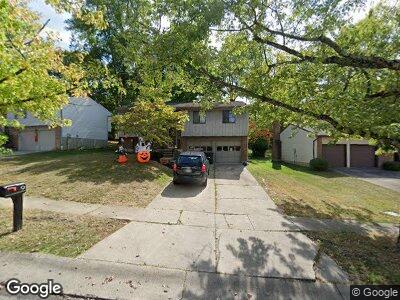
9 Sugarmaple Ct Cincinnati, OH 45236
Estimated Value: $289,319 - $331,000
3
Beds
2
Baths
1,568
Sq Ft
$197/Sq Ft
Est. Value
About This Home
This home is located at 9 Sugarmaple Ct, Cincinnati, OH 45236 and is currently estimated at $308,330, approximately $196 per square foot. 9 Sugarmaple Ct is a home located in Hamilton County with nearby schools including Reading Community High School, Linden Grove School, and Mount Notre Dame High School.
Ownership History
Date
Name
Owned For
Owner Type
Purchase Details
Closed on
Mar 2, 2019
Sold by
Tierney Martin P and Tierney Patricia L
Bought by
Moore Kenneth and Moore Cynthia
Current Estimated Value
Purchase Details
Closed on
Sep 21, 2005
Sold by
Ferrell Douglas R
Bought by
Tierney Martin P and Tierney Patricia L
Home Financials for this Owner
Home Financials are based on the most recent Mortgage that was taken out on this home.
Original Mortgage
$114,600
Interest Rate
6.25%
Mortgage Type
Fannie Mae Freddie Mac
Purchase Details
Closed on
May 25, 2004
Sold by
Miller Darlene M
Bought by
Ferrell Douglas R
Home Financials for this Owner
Home Financials are based on the most recent Mortgage that was taken out on this home.
Original Mortgage
$122,075
Interest Rate
5.86%
Mortgage Type
Fannie Mae Freddie Mac
Purchase Details
Closed on
Aug 10, 1999
Sold by
Scott Broh and Scott Sara
Bought by
Miller Darlene M
Home Financials for this Owner
Home Financials are based on the most recent Mortgage that was taken out on this home.
Original Mortgage
$96,000
Interest Rate
6.75%
Create a Home Valuation Report for This Property
The Home Valuation Report is an in-depth analysis detailing your home's value as well as a comparison with similar homes in the area
Home Values in the Area
Average Home Value in this Area
Purchase History
| Date | Buyer | Sale Price | Title Company |
|---|---|---|---|
| Moore Kenneth | $124,290 | None Available | |
| Tierney Martin P | $143,300 | None Available | |
| Ferrell Douglas R | $128,500 | Tri-Star Title Agency Inc | |
| Miller Darlene M | $120,000 | -- |
Source: Public Records
Mortgage History
| Date | Status | Borrower | Loan Amount |
|---|---|---|---|
| Previous Owner | Tierney Martin P | $111,000 | |
| Previous Owner | Tierney Martin P | $114,600 | |
| Previous Owner | Tierney Martin P | $14,181 | |
| Previous Owner | Ferrell Douglas R | $122,075 | |
| Previous Owner | Miller Darlene M | $96,000 |
Source: Public Records
Tax History Compared to Growth
Tax History
| Year | Tax Paid | Tax Assessment Tax Assessment Total Assessment is a certain percentage of the fair market value that is determined by local assessors to be the total taxable value of land and additions on the property. | Land | Improvement |
|---|---|---|---|---|
| 2024 | $3,921 | $72,213 | $12,275 | $59,938 |
| 2023 | $3,914 | $72,213 | $12,275 | $59,938 |
| 2022 | $3,760 | $53,883 | $10,504 | $43,379 |
| 2021 | $3,217 | $53,883 | $10,504 | $43,379 |
| 2020 | $3,173 | $53,883 | $10,504 | $43,379 |
| 2019 | $2,910 | $44,902 | $8,754 | $36,148 |
| 2018 | $2,911 | $44,902 | $8,754 | $36,148 |
| 2017 | $2,782 | $44,902 | $8,754 | $36,148 |
| 2016 | $3,097 | $49,613 | $10,252 | $39,361 |
| 2015 | $3,082 | $49,613 | $10,252 | $39,361 |
| 2014 | $2,709 | $49,613 | $10,252 | $39,361 |
| 2013 | $2,746 | $50,628 | $10,462 | $40,166 |
Source: Public Records
Map
Nearby Homes
- 3736 Glengary Ave
- 3558 Lobelia Dr
- 1647 Krylon Dr
- 1162 Alwil Dr
- 1202 Thurnridge Dr
- 1139 Alwil Dr
- 8563 Donegal Dr
- 8435 Wexford Ave
- 8319 Lynnehaven Dr
- 234 Mcguire Ln
- 229 Mcguire Ln
- 9324 Old Plainfield Rd
- 2062 Longmeadow Ln
- 9521 Heather Ct
- 3862 Chimney Hill Dr
- 741 Maple Dr
- 313 Genoma Dr
- 47 Carpenters Ridge
- 4122 Estermarie Dr
- 628 Maple Dr
- 9 Sugarmaple Ct
- 5 Sugarmaple Ct
- 13 Sugarmaple Ct
- 75 Waxwing Dr
- 2908 Maple Tree Ct
- 2904 Maple Tree Ct
- 2912 Maple Tree Ct
- 21 Sugarmaple Ct
- 14 Sugarmaple Ct
- 10 Sugarmaple Ct
- 6 Sugarmaple Ct
- 71 Waxwing Dr
- 18 Sugarmaple Ct
- 2 Sugarmaple Ct
- 2916 Maple Tree Ct
- 22 Sugarmaple Ct
- 25 Sugarmaple Ct
- 2920 Maple Tree Ct
- 85 Waxwing Dr
- 26 Sugarmaple Ct