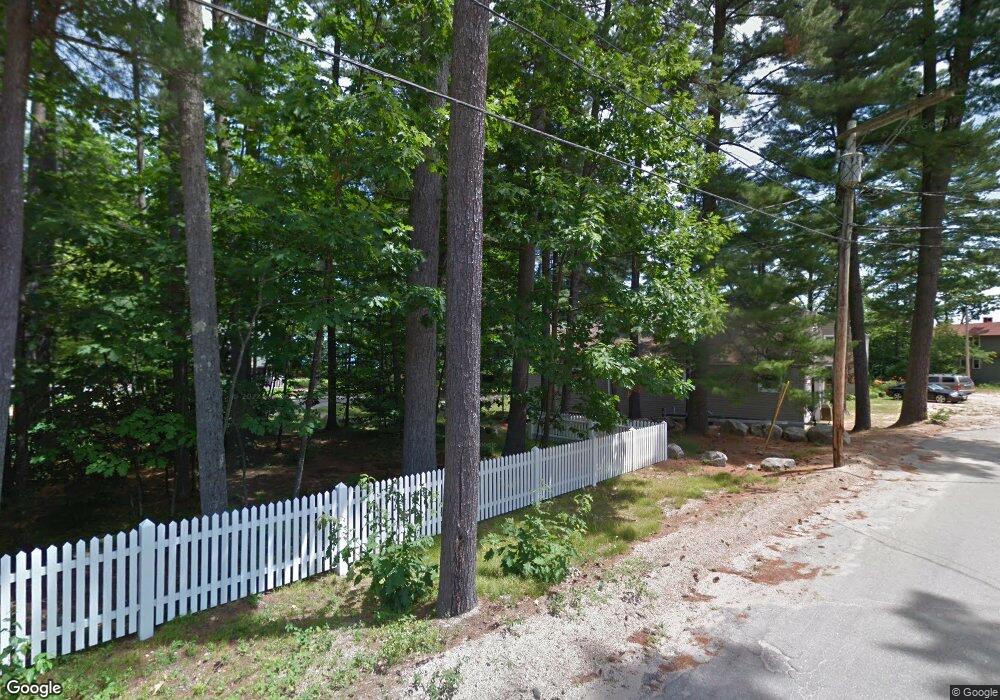
9 Waters Edge Rd Sebago, ME 04029
Estimated Value: $660,000 - $955,000
--
Bed
--
Bath
1,275
Sq Ft
$651/Sq Ft
Est. Value
About This Home
This home is located at 9 Waters Edge Rd, Sebago, ME 04029 and is currently estimated at $829,522, approximately $650 per square foot. 9 Waters Edge Rd is a home with nearby schools including Lake Region High School.
Ownership History
Date
Name
Owned For
Owner Type
Purchase Details
Closed on
Mar 18, 2008
Sold by
Braley Brandon G
Bought by
Braley Brandon G and Logan Laurie L
Current Estimated Value
Home Financials for this Owner
Home Financials are based on the most recent Mortgage that was taken out on this home.
Original Mortgage
$0
Interest Rate
6.13%
Mortgage Type
Purchase Money Mortgage
Create a Home Valuation Report for This Property
The Home Valuation Report is an in-depth analysis detailing your home's value as well as a comparison with similar homes in the area
Home Values in the Area
Average Home Value in this Area
Purchase History
| Date | Buyer | Sale Price | Title Company |
|---|---|---|---|
| Braley Brandon G | -- | -- | |
| Braley Brandon G | -- | -- |
Source: Public Records
Mortgage History
| Date | Status | Borrower | Loan Amount |
|---|---|---|---|
| Closed | Braley Brandon G | $0 |
Source: Public Records
Tax History Compared to Growth
Tax History
| Year | Tax Paid | Tax Assessment Tax Assessment Total Assessment is a certain percentage of the fair market value that is determined by local assessors to be the total taxable value of land and additions on the property. | Land | Improvement |
|---|---|---|---|---|
| 2024 | $9,007 | $660,353 | $595,600 | $64,753 |
| 2023 | $8,571 | $660,353 | $595,600 | $64,753 |
| 2022 | $6,868 | $660,353 | $595,600 | $64,753 |
| 2021 | $6,504 | $660,353 | $595,600 | $64,753 |
| 2020 | $5,181 | $368,725 | $316,575 | $52,150 |
| 2019 | $5,015 | $368,725 | $316,575 | $52,150 |
| 2018 | $4,849 | $368,725 | $316,575 | $52,150 |
| 2017 | $4,775 | $368,725 | $316,575 | $52,150 |
| 2016 | $4,535 | $368,725 | $316,575 | $52,150 |
| 2015 | $4,830 | $368,725 | $316,575 | $52,150 |
| 2014 | $4,919 | $368,725 | $316,575 | $52,150 |
Source: Public Records
Map
Nearby Homes